PECI: Philadelphia Preliminary Demographics
NOTE: Hispanic, Native American, Pacific Islander, and Drop Out percentages are colored numerically and represent absolute values in percents on a continuous scale. This means only extreme outliers will show darker colors, this is because they didn’t have enough observations to color by quantiles.
All other maps are colored by quantiles, which divides the data into groups with an equal number of census tracts, making it easy to compare between the high-value and low-value populations or areas. This is better for identifying clusters and comparing different areas.
You’ll be able to see the absolute value by hovering and clicking on the tract.
The color palette goes from low (purple) to high (yellow). All census data from 2024 5-year ACS, aggregated by census tracts.
Population Map
Age and Sex Map
Education Map
Housing Map
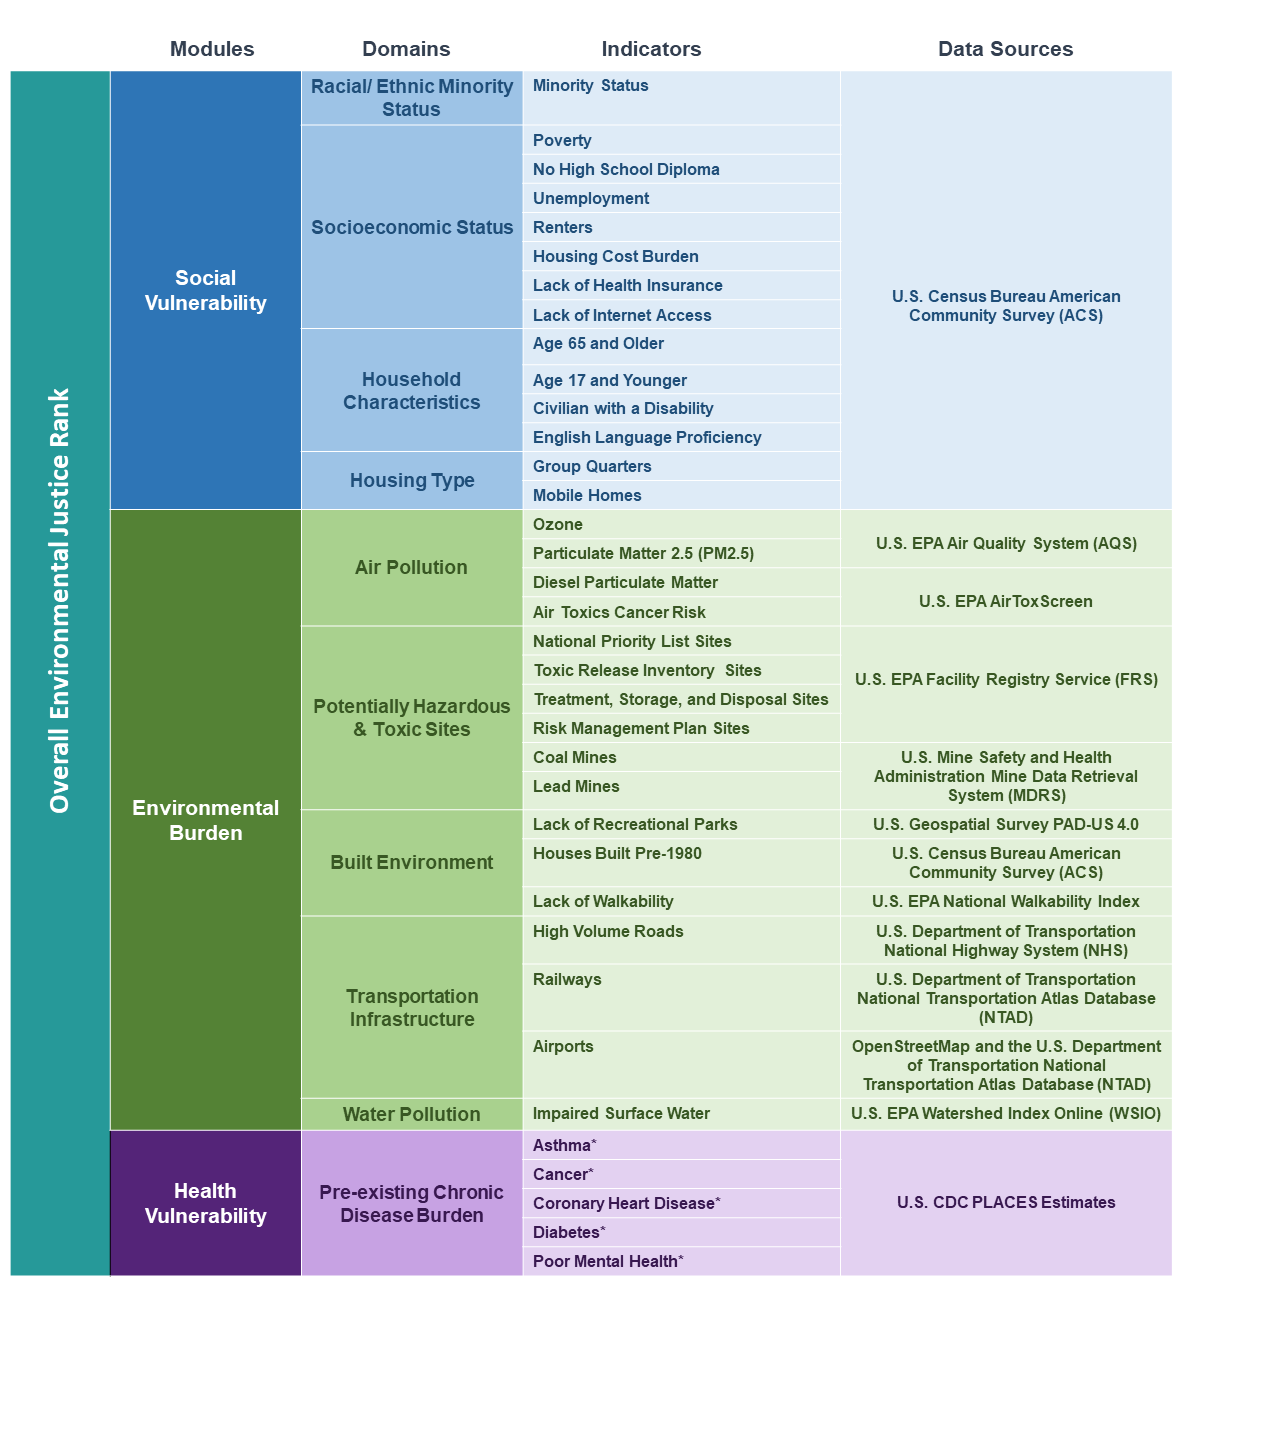
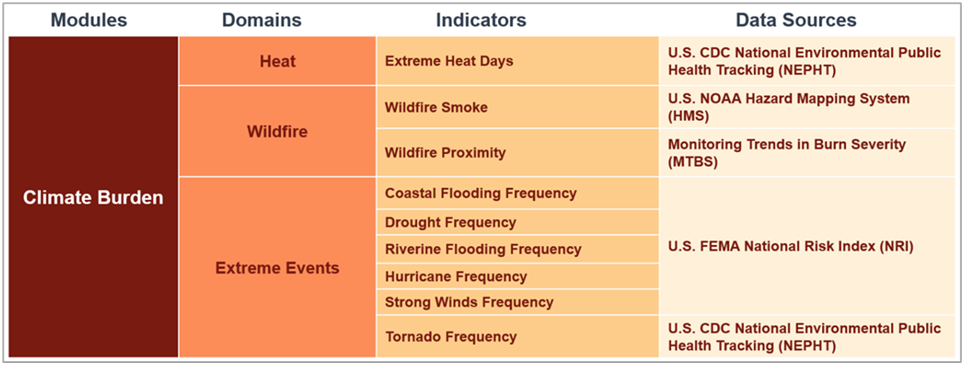
2024 Environmental Justice Index (EJI) Map
2022 Social Vulnerability Index (SVI) Map