Model Citizens Consulting
Improving Property Tax Assessments
Philadelphia Housing Price Prediction
The Question: What data do we have on property, the Census, and built environment that can help predict housing prices?
The Motivation: Philadelphia is a city of more than 1.5 million people and growing, we need properties to be accurately assessed.
Why This Matters to the Office of Property Assessment
Improving the Office of Property Assessment’s Automated Valuation Model (AVM) can potentially:
More stable values aligned with market rates for properties being sold.
Alleviate burden from gentrification in previously disinvested neighborhoods.
The Problem & The Goal
What We Want
Equitable taxation for residents.
Financial stability for Philadelphia.
Help set the future for more reliable open data.
Data Overview
Philadelphia Properties and Current Assessments from Open Data Philly (n = 559,322)
- Property Coordinates, Sale Date (n = 34,559; 2023-2024), Sale Price (> $10,000; n = 26,344), Property Characteristics: bathrooms, basement type, central air, fireplaces, fuel type, garages, square feet, stories, year built (n = 18,221)
2023 5-Year American Community Survey (ACS) from the United States Census Bureau (n = 28,261; 2019-2023)
- Median Household Income, Single-Family Detached Homes, Vacancies (n = 3,401)
Data Overview
- Neighborhood Boundaries (n = 159; 2025), Parks (n = 15; 2025), Philadelphia 2020 Census Tract Boundaries (n = 3,446; 2020), SEPTA Transit Stations (n = 13,884; 2025)
- Points of Interest: Convenience and Food-Related Amenities (n = 18,413; 2025)
Where Are Expensive Homes?
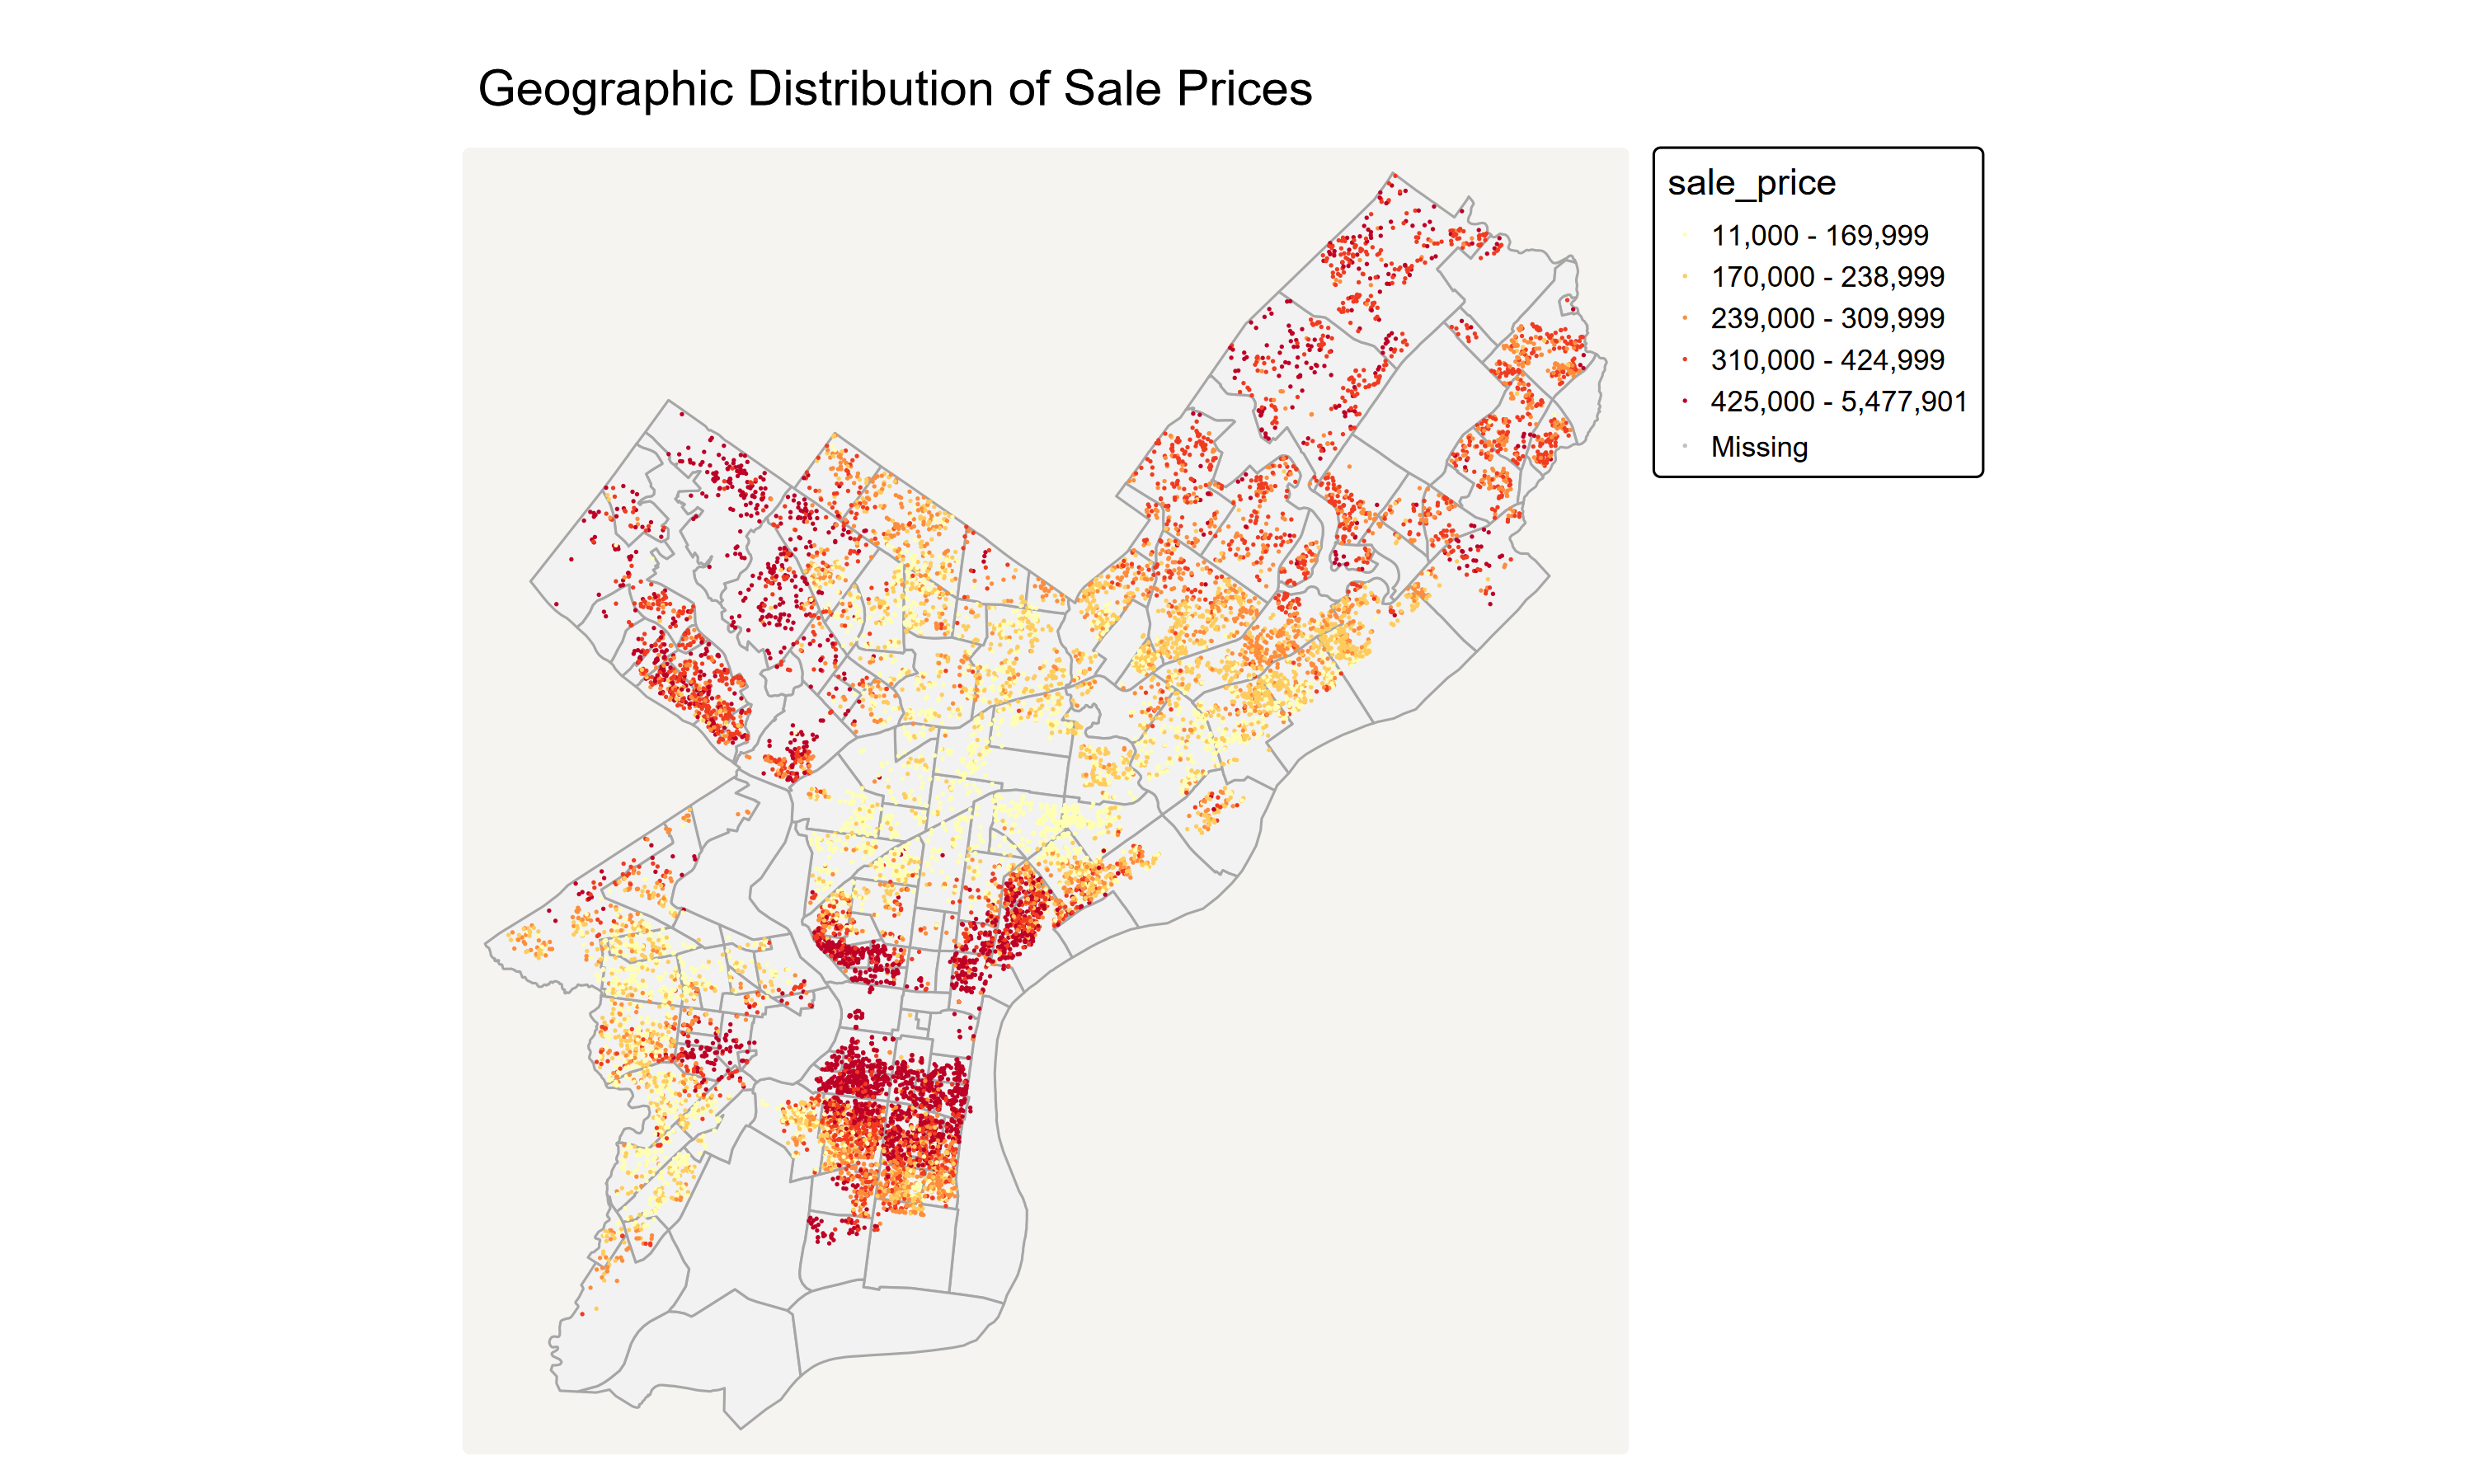
Findings
Higher Prices: Center City, University City, the riverfront, and affluent Northwest pockets.
Potentially due to easy access to transit and amenities.
Lower Prices: North of Broad Street into parts of West and North Philadelphia.
Potentially reflecting long-term disinvestment.
Sale price is place-dependent in Philadelphia, mostly due to neighborhood qualities.
What Drives Prices?
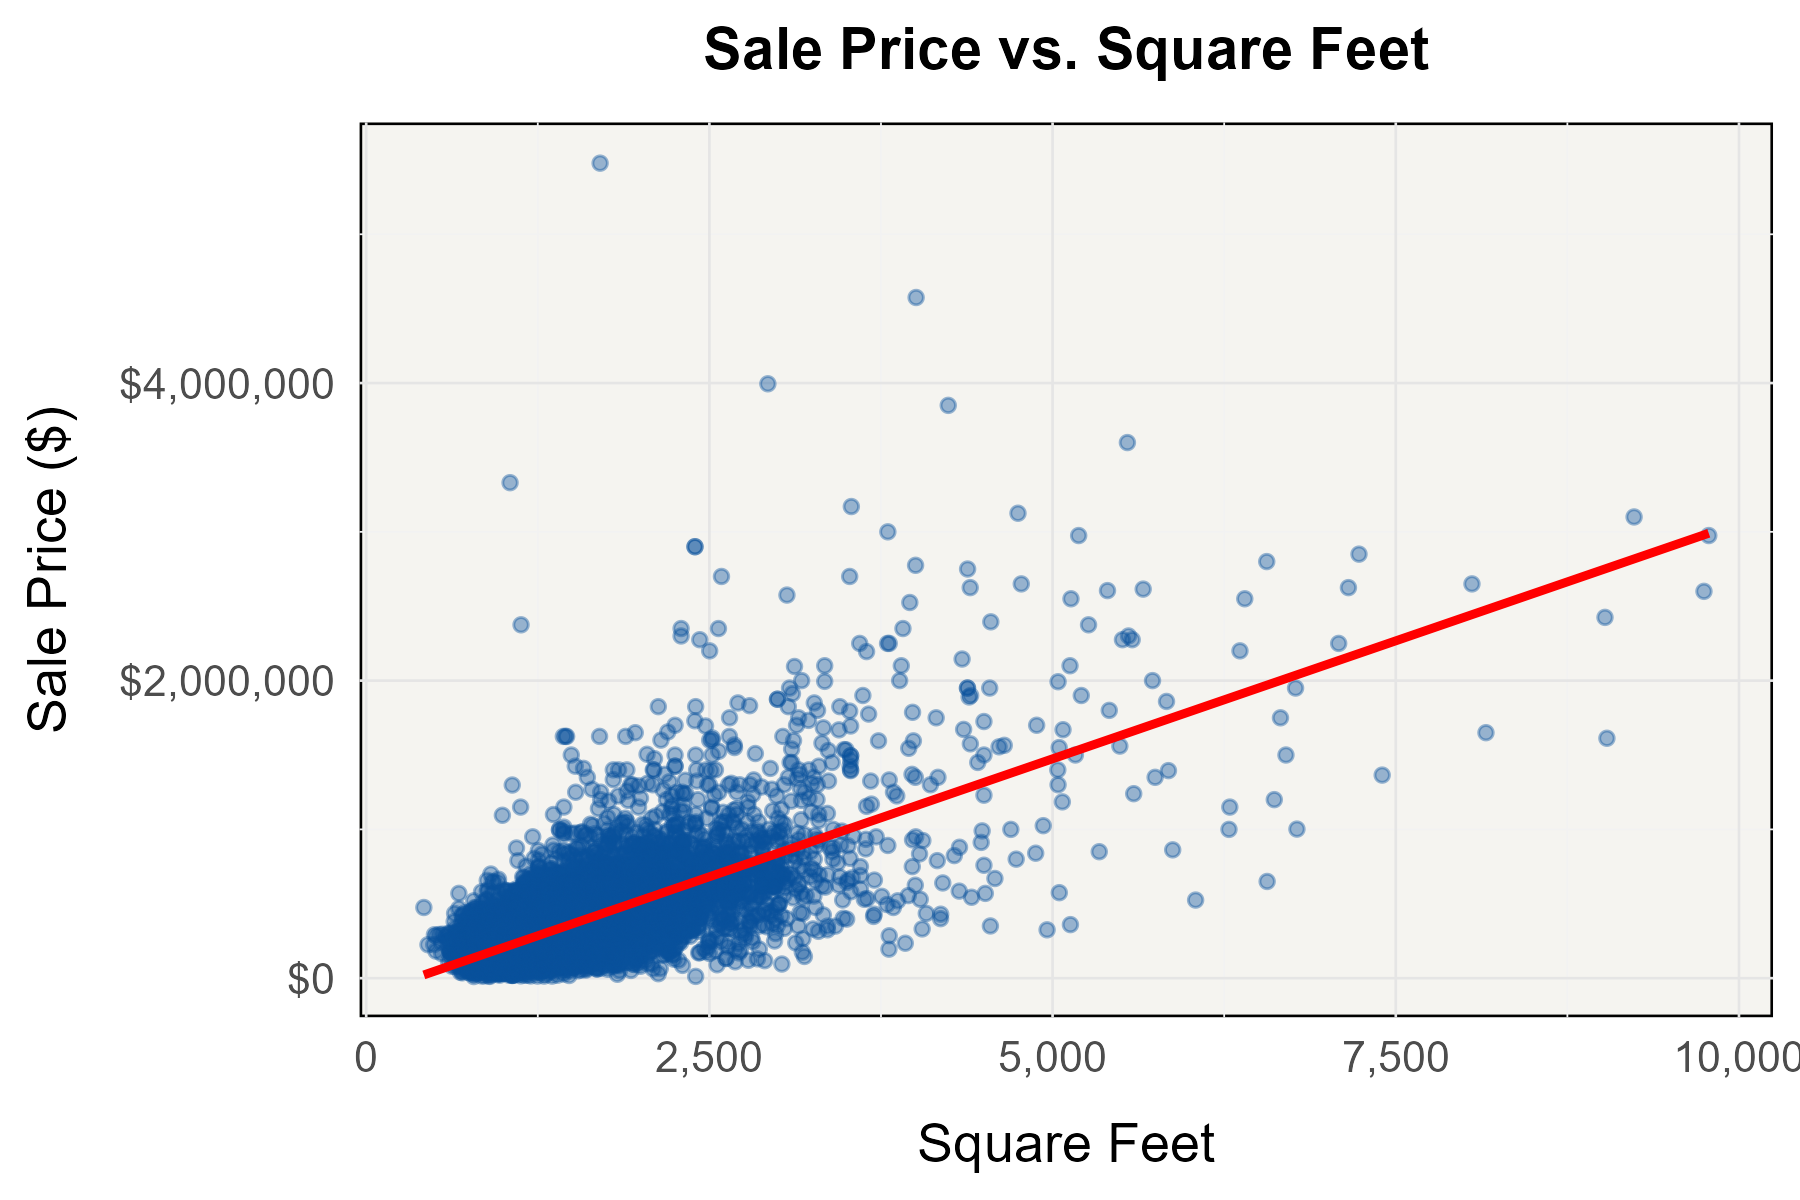
- Larger homes = an increase in price, but only up to a certain point.
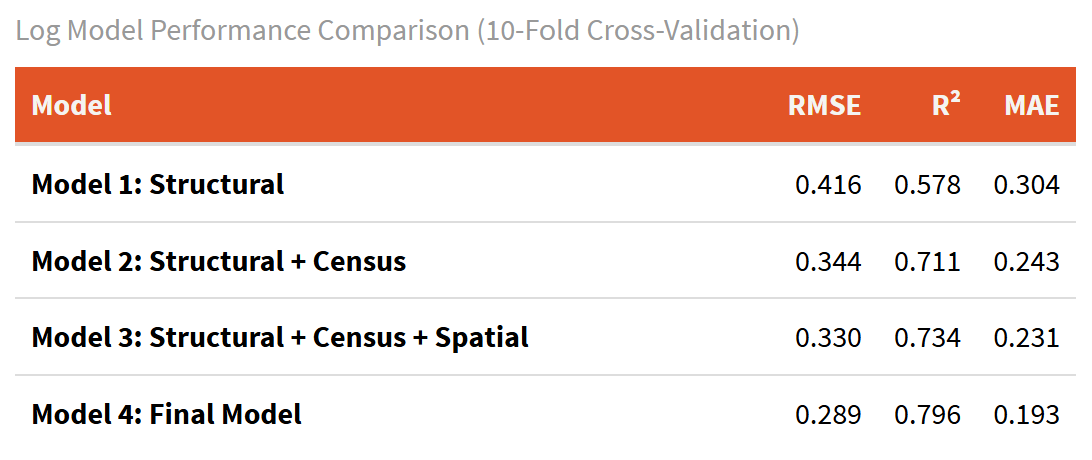
Model Comparison & Performance
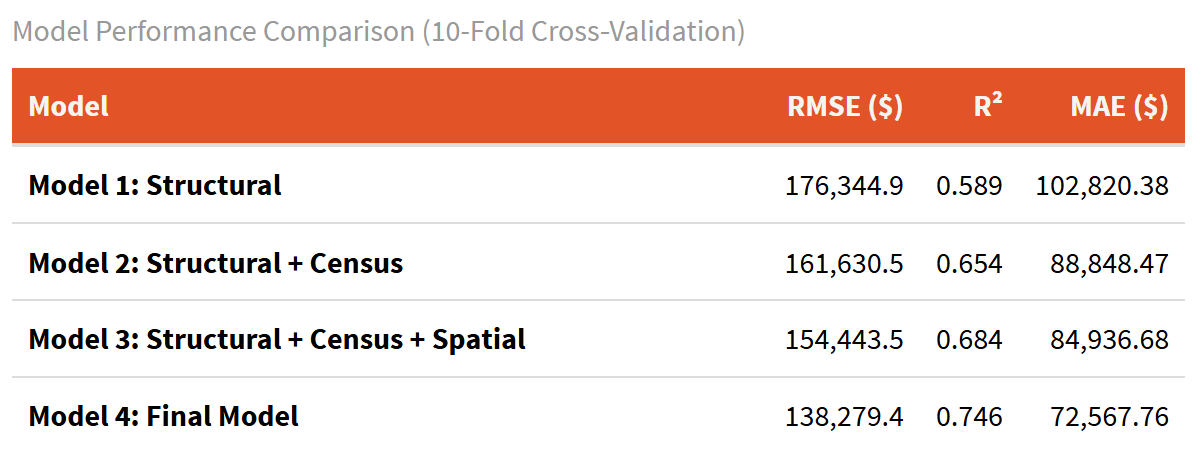
RMSE = 138,279.40 → Predicted sale price differs by about ± $138,279 from actual market sale price.
R² = 0.746 → Explains 75% of variance in home prices.
Top Predictors
Neighborhoods (e.g. Fitler Square $431,911.65 > East Falls)
Livable Square Footage ($187.32 increase)
Median Household Income ($0.63 increase)
Hardest To Predict
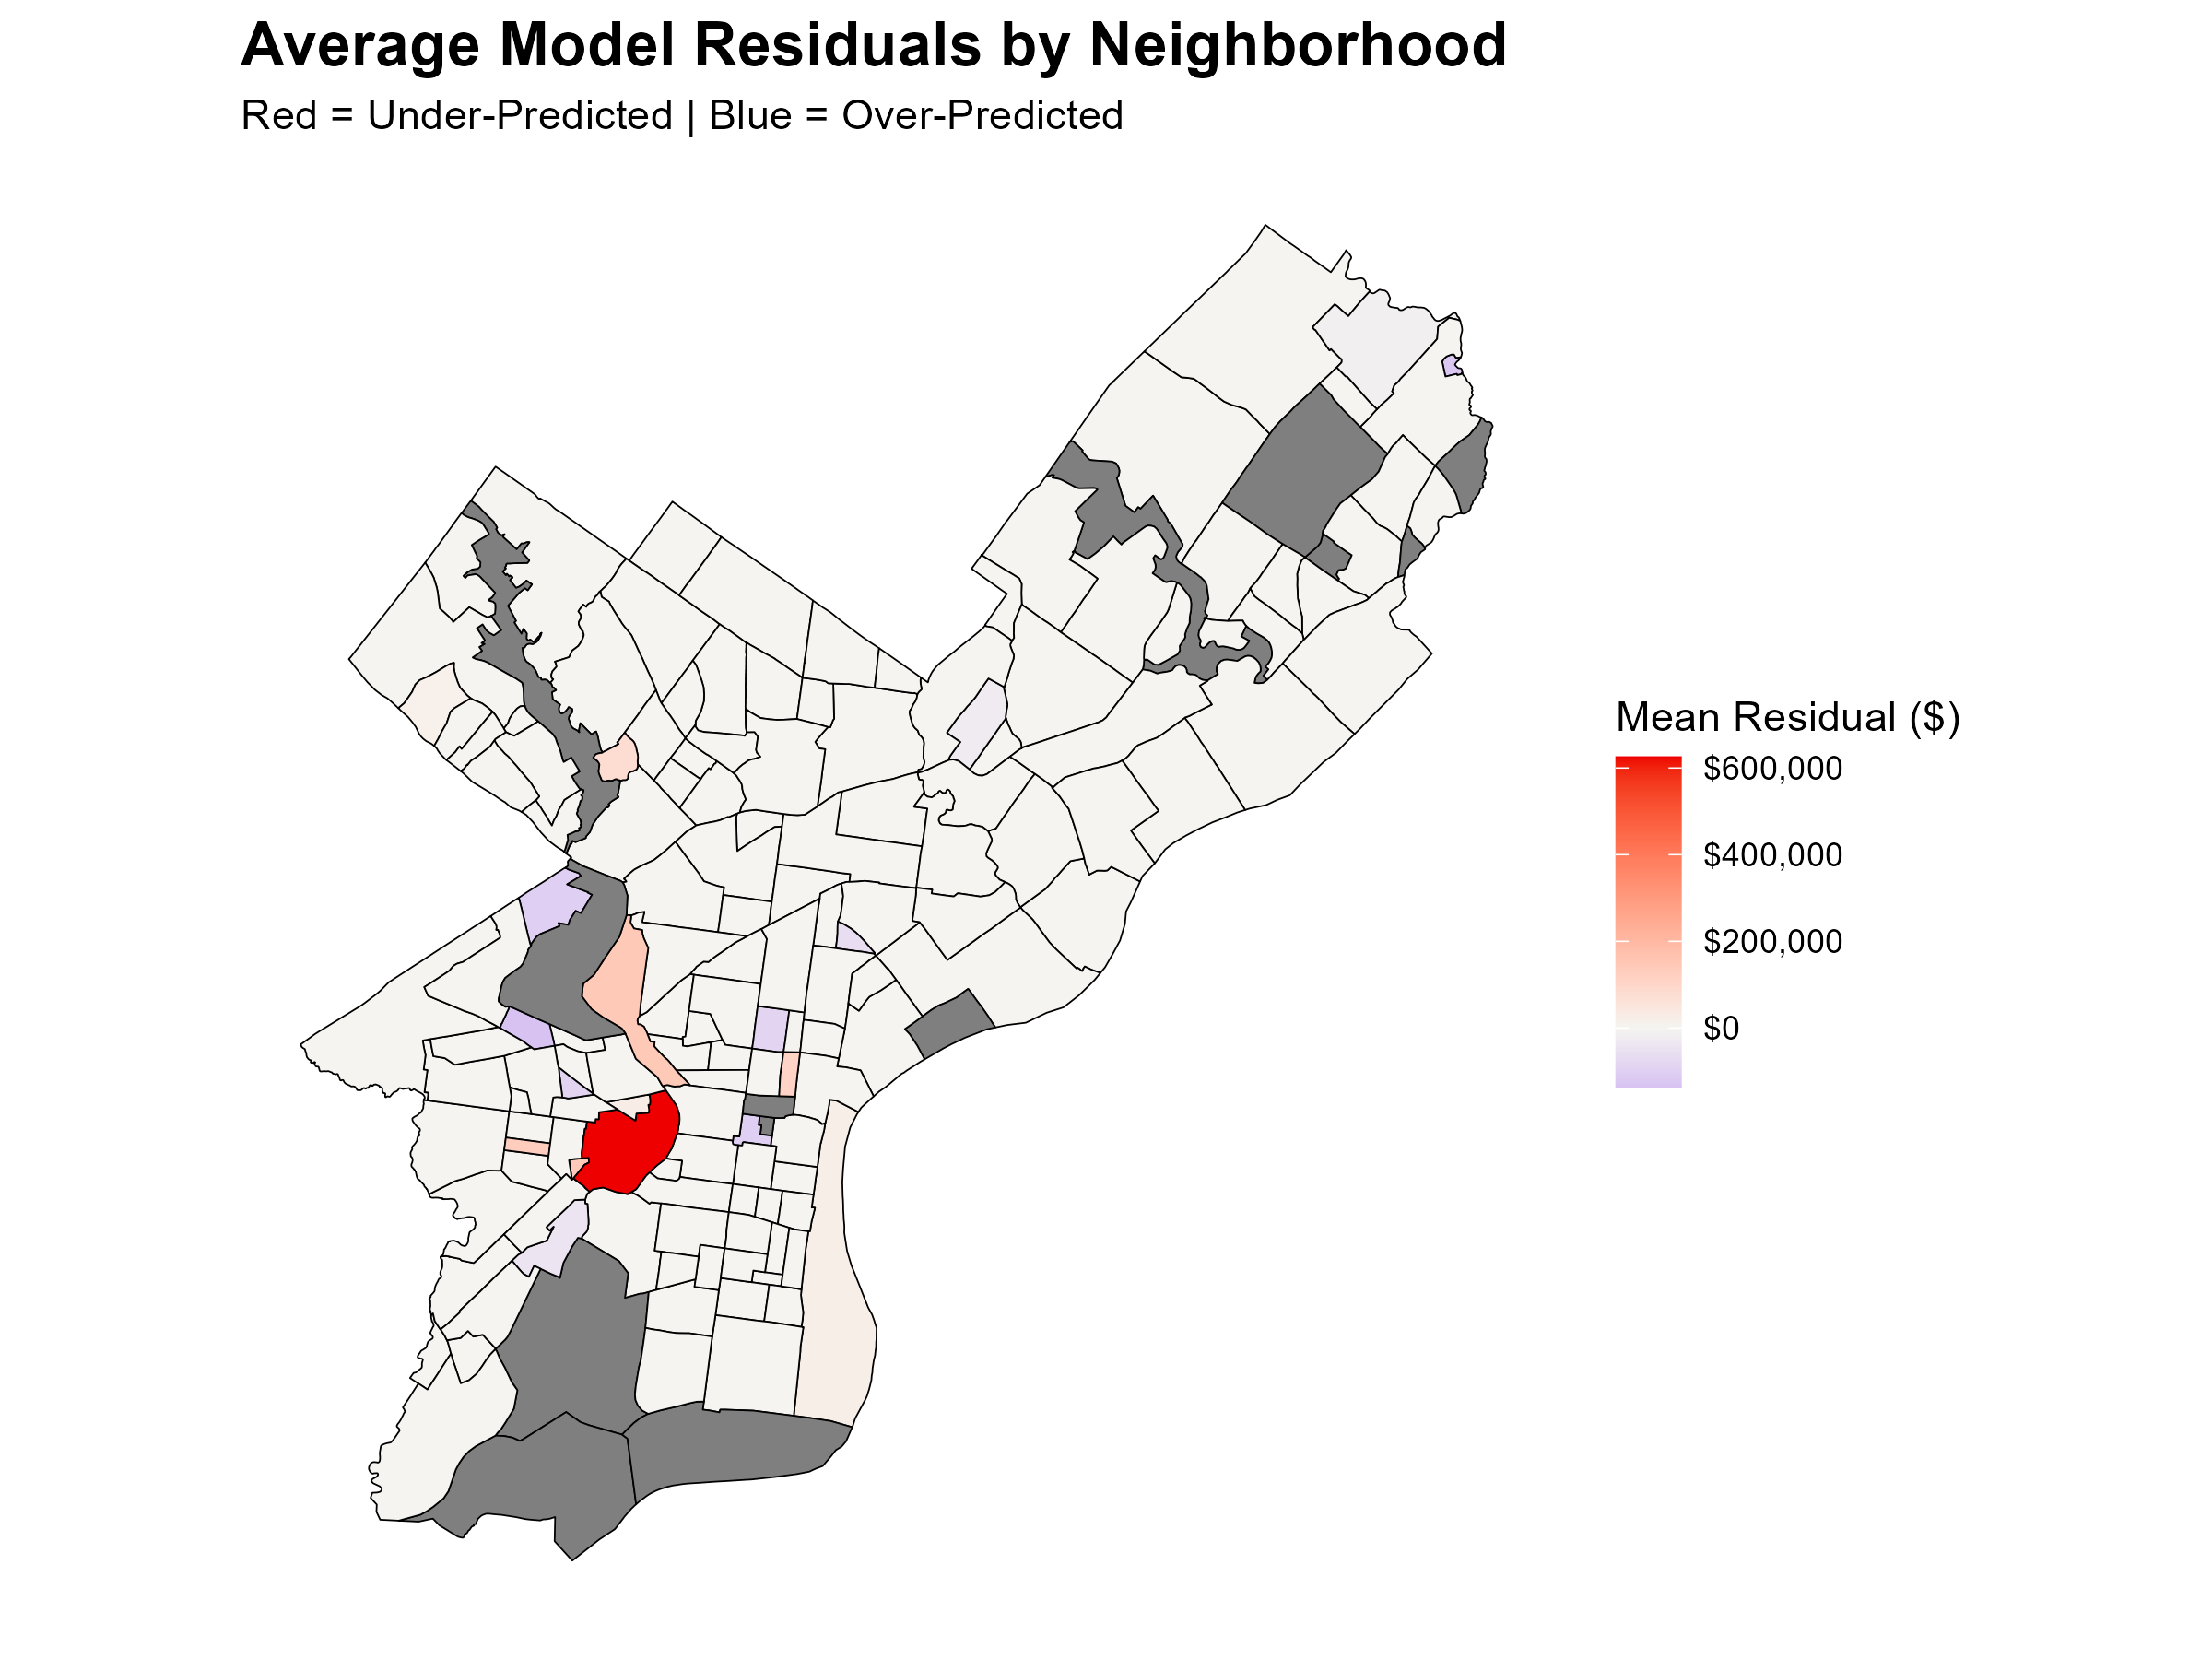
Conclusions & Recommendations
Human review for over-valued neighborhoods that are being gentrified.
Limitations & Next Steps
Limitations / Ethical Concerns:
Overvalues some disinvested neighborhoods and undervalues wealthier ones.
Areas with residents depend more on personal vehicles, this model is predicting on public transit, not highways.
Future Potential:
Incorporate additional categorical variables after consideration, like land use and employment for university areas.
Separate rural modeling can be helpful too.