The Philadelphia Eviction Early Warning System
A Predictive Model for Proactive Resource Allocation
2025-12-08
Research Question
“Where should renter’s assistance programs be targeted in Philadelphia?”
The Goal: Move from reactive crisis management to proactive triage.
Philadelphia Context
331,415 Philadelphia households are renters.
![]()
Policy Gap: The Emergency Rental Assistance Program (ERAP) just ended in September 30, 2025, removing a critical safety net.
![]()
Monthly Eviction Trends and Volatility Issues
- Trend: Filings are rebounding to pre-pandemic levels but are affecting neighborhoods unevenly.
![]()
Data Sources
- Eviction Lab: Monthly Filing Counts
- OpenDataPhilly:
- Tax Delinquency: Proxy for landlord financial distress.
- Census ACS (2023): Poverty Rate, Rent Burden, Single-Parent Households.
Data Cleaning
- Sealed Tracts (Privacy): We identified “Sealed Tracts” containing mass eviction events (up to 694 filings/month).
- Tax Data: Cleaned to focus on true delinquency with active penalties rather than minor overdue bills.
- Outlier Management: We capped training data at the 99.75th percentile (20 filings) to stabilize the model, but tested on raw data to prove real-world robustness.
Exploratory Analysis
Eviction data is zero-inflated and overdispersed.
- Conclusion: OLS and Poisson models are invalid, use Negative Binomial Regression.
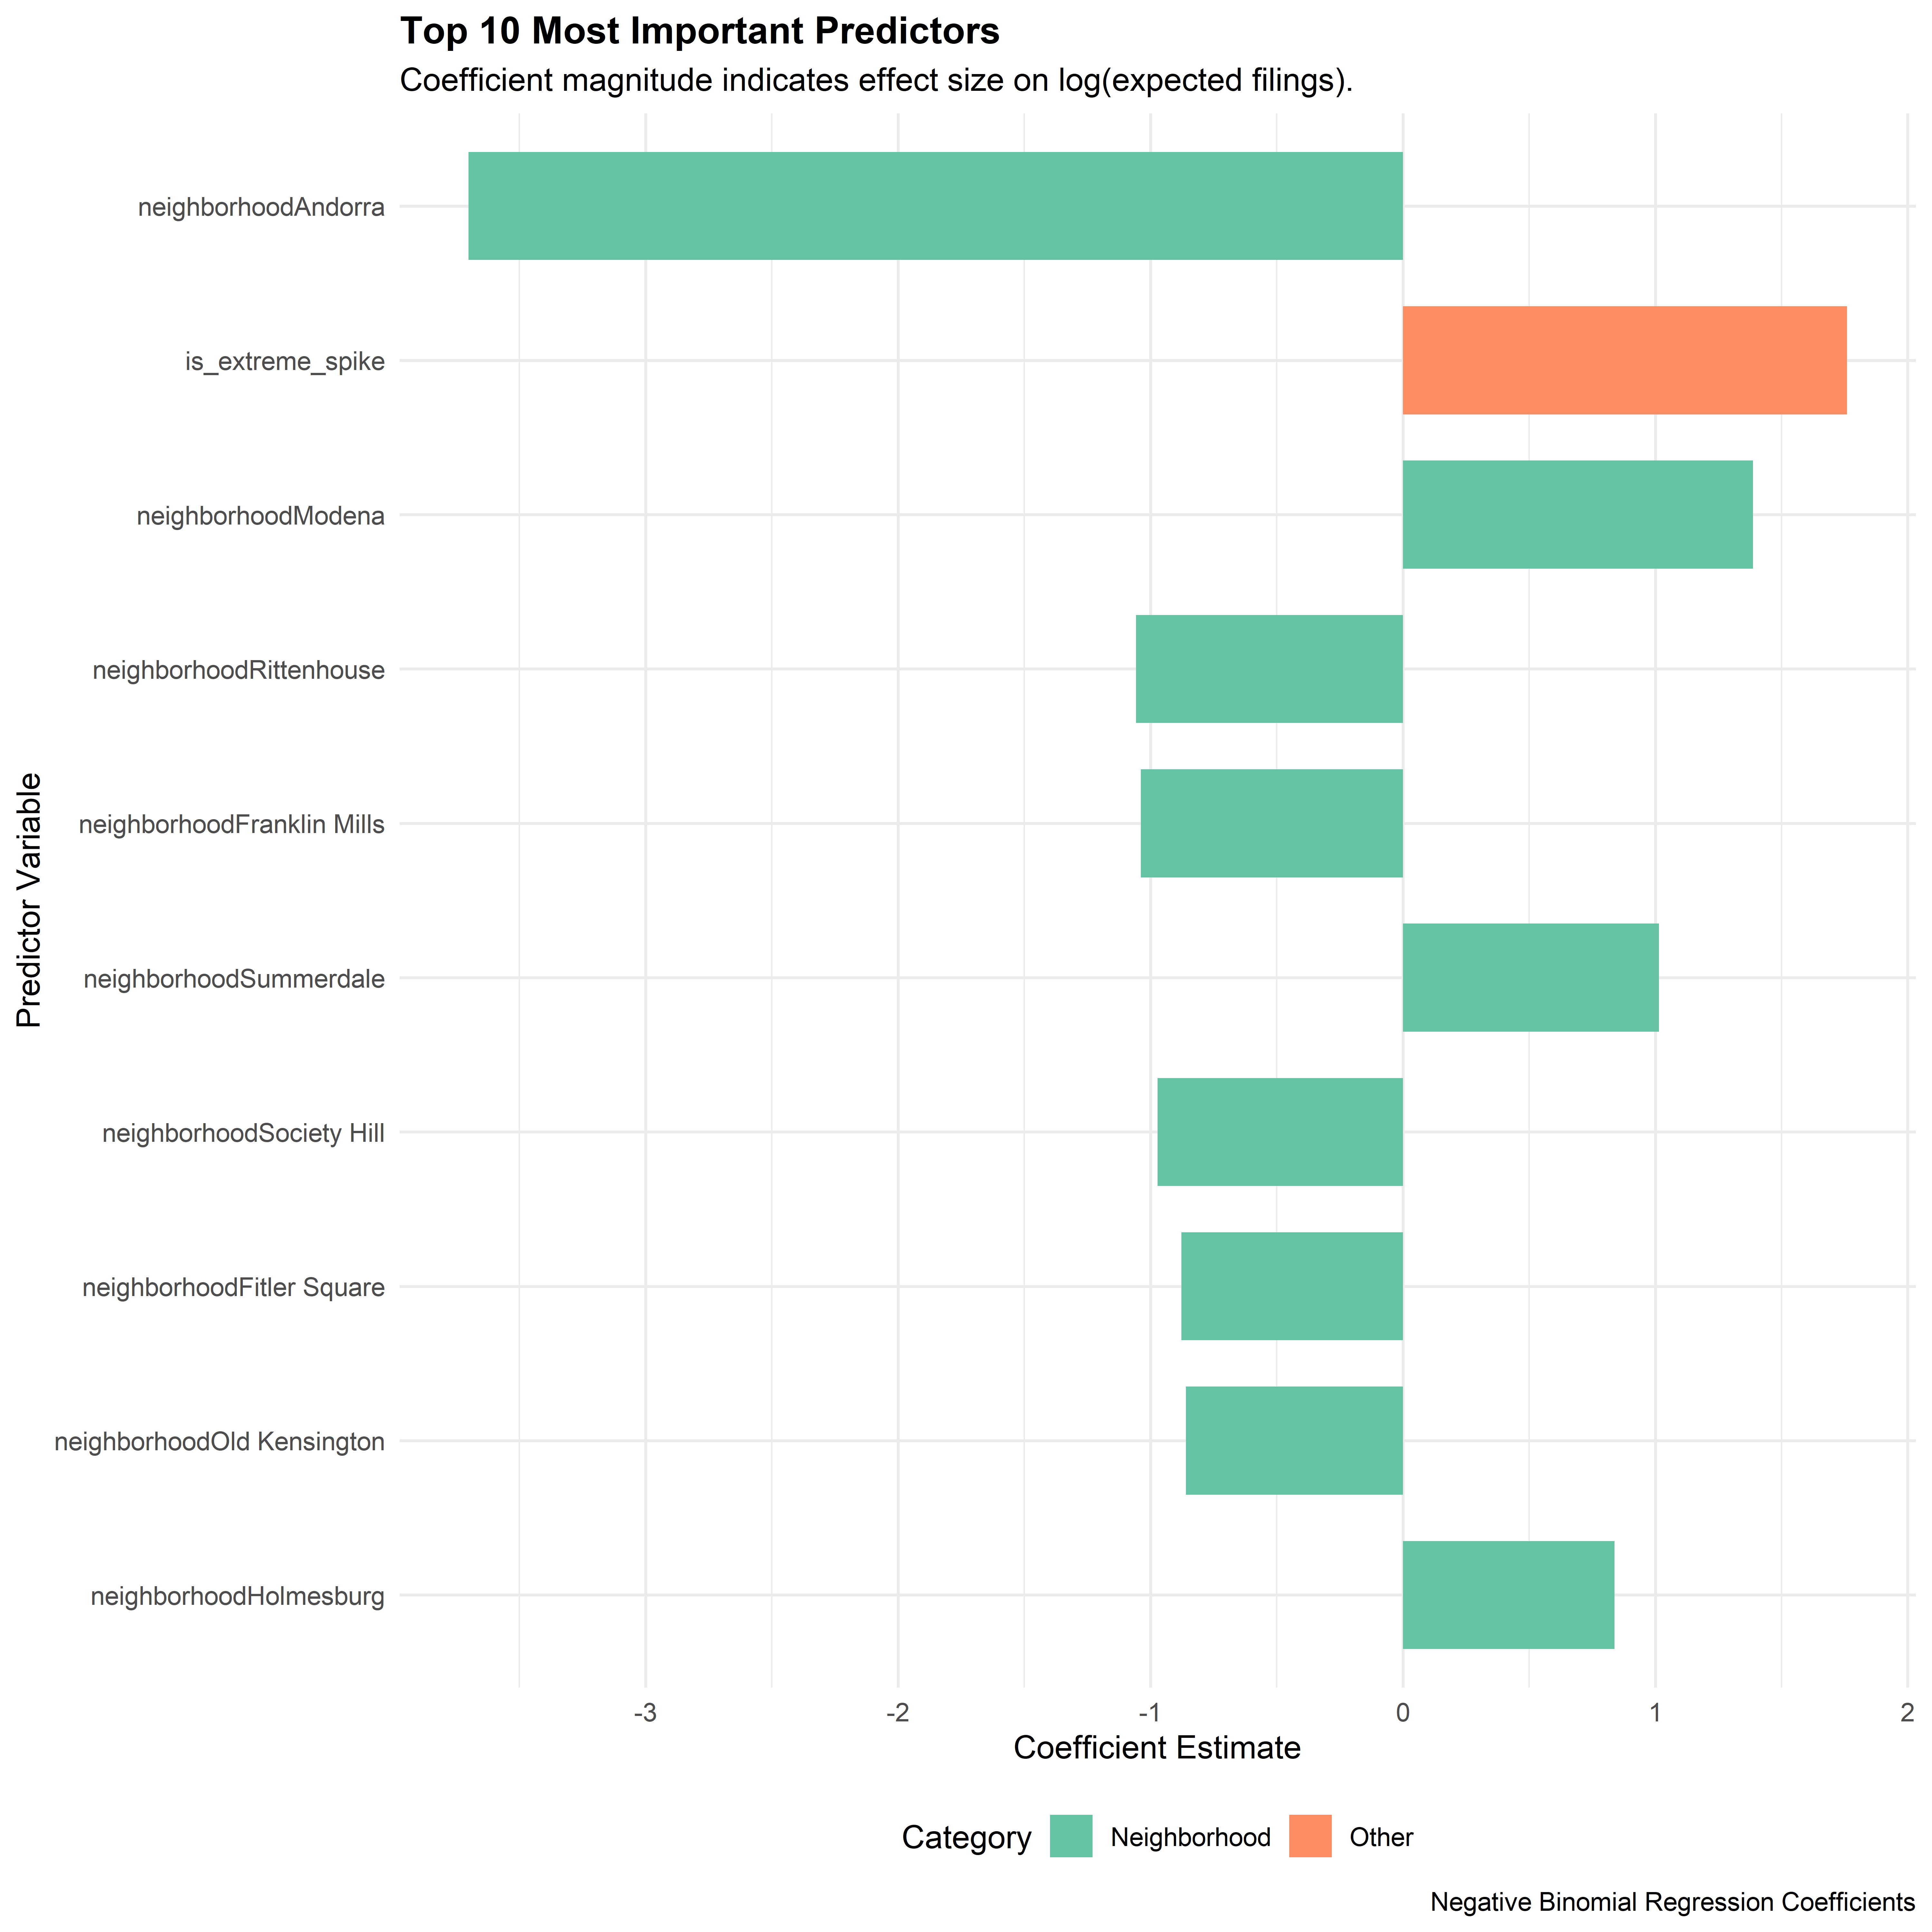
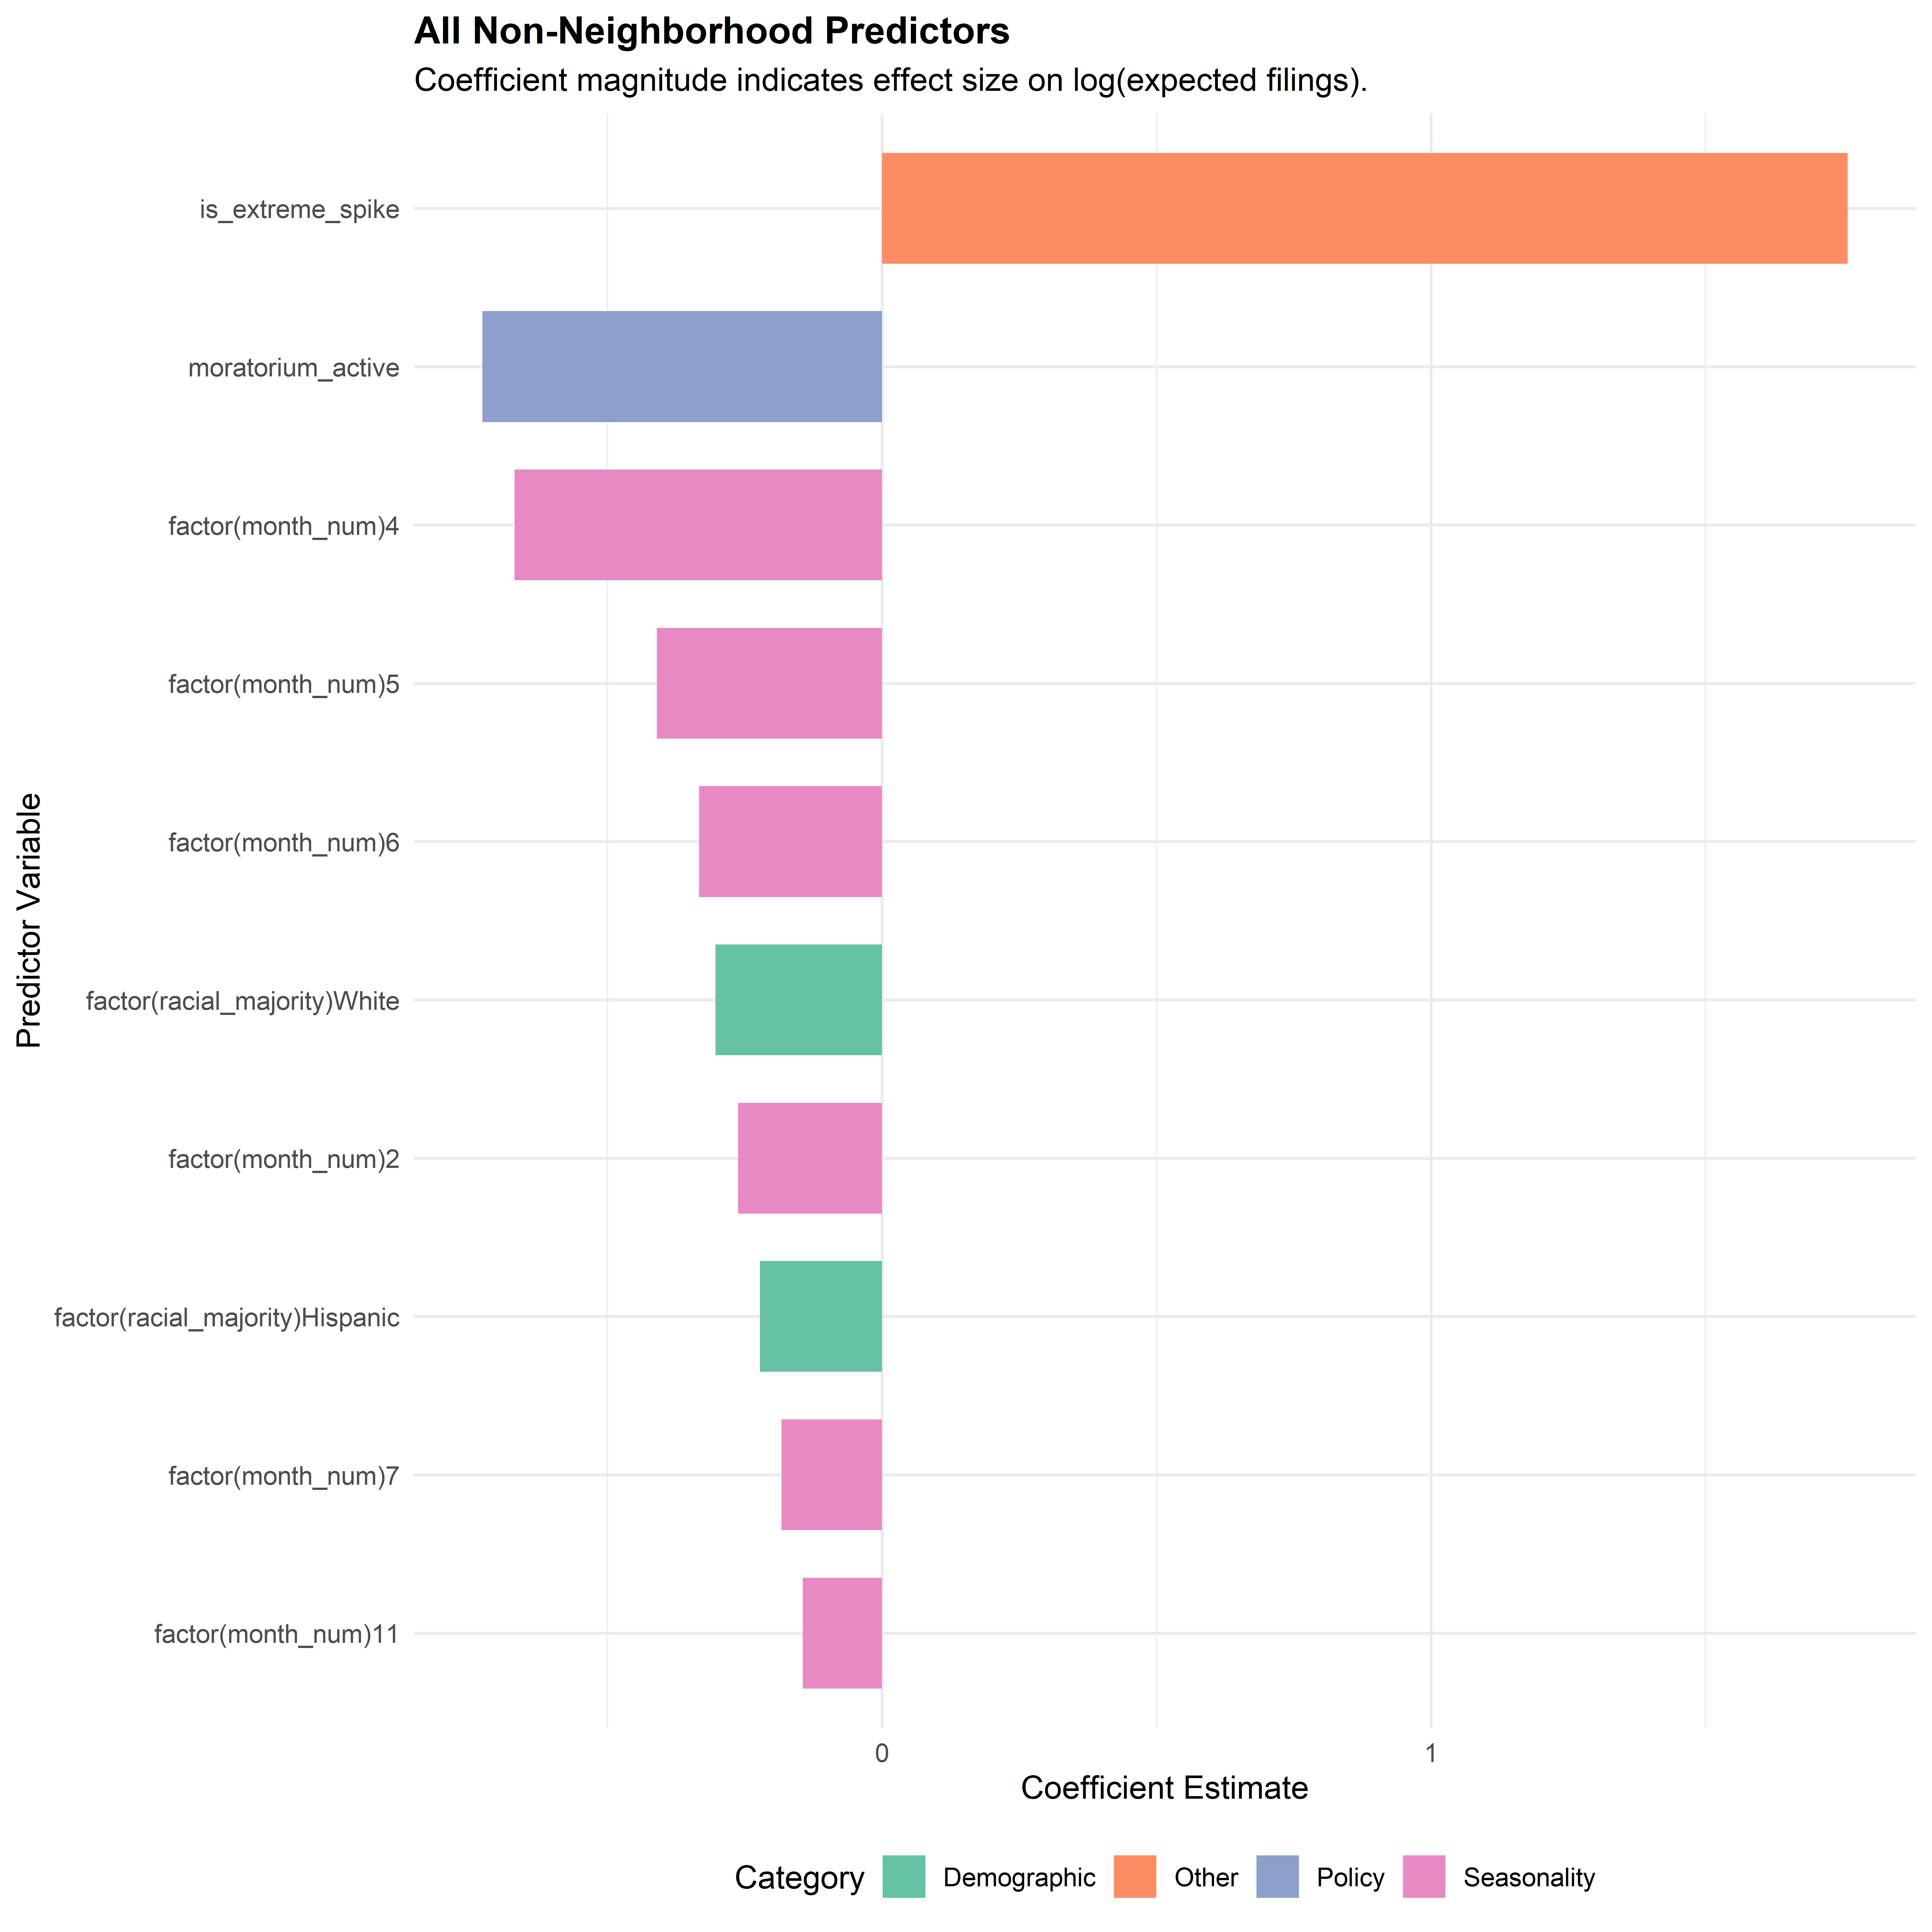
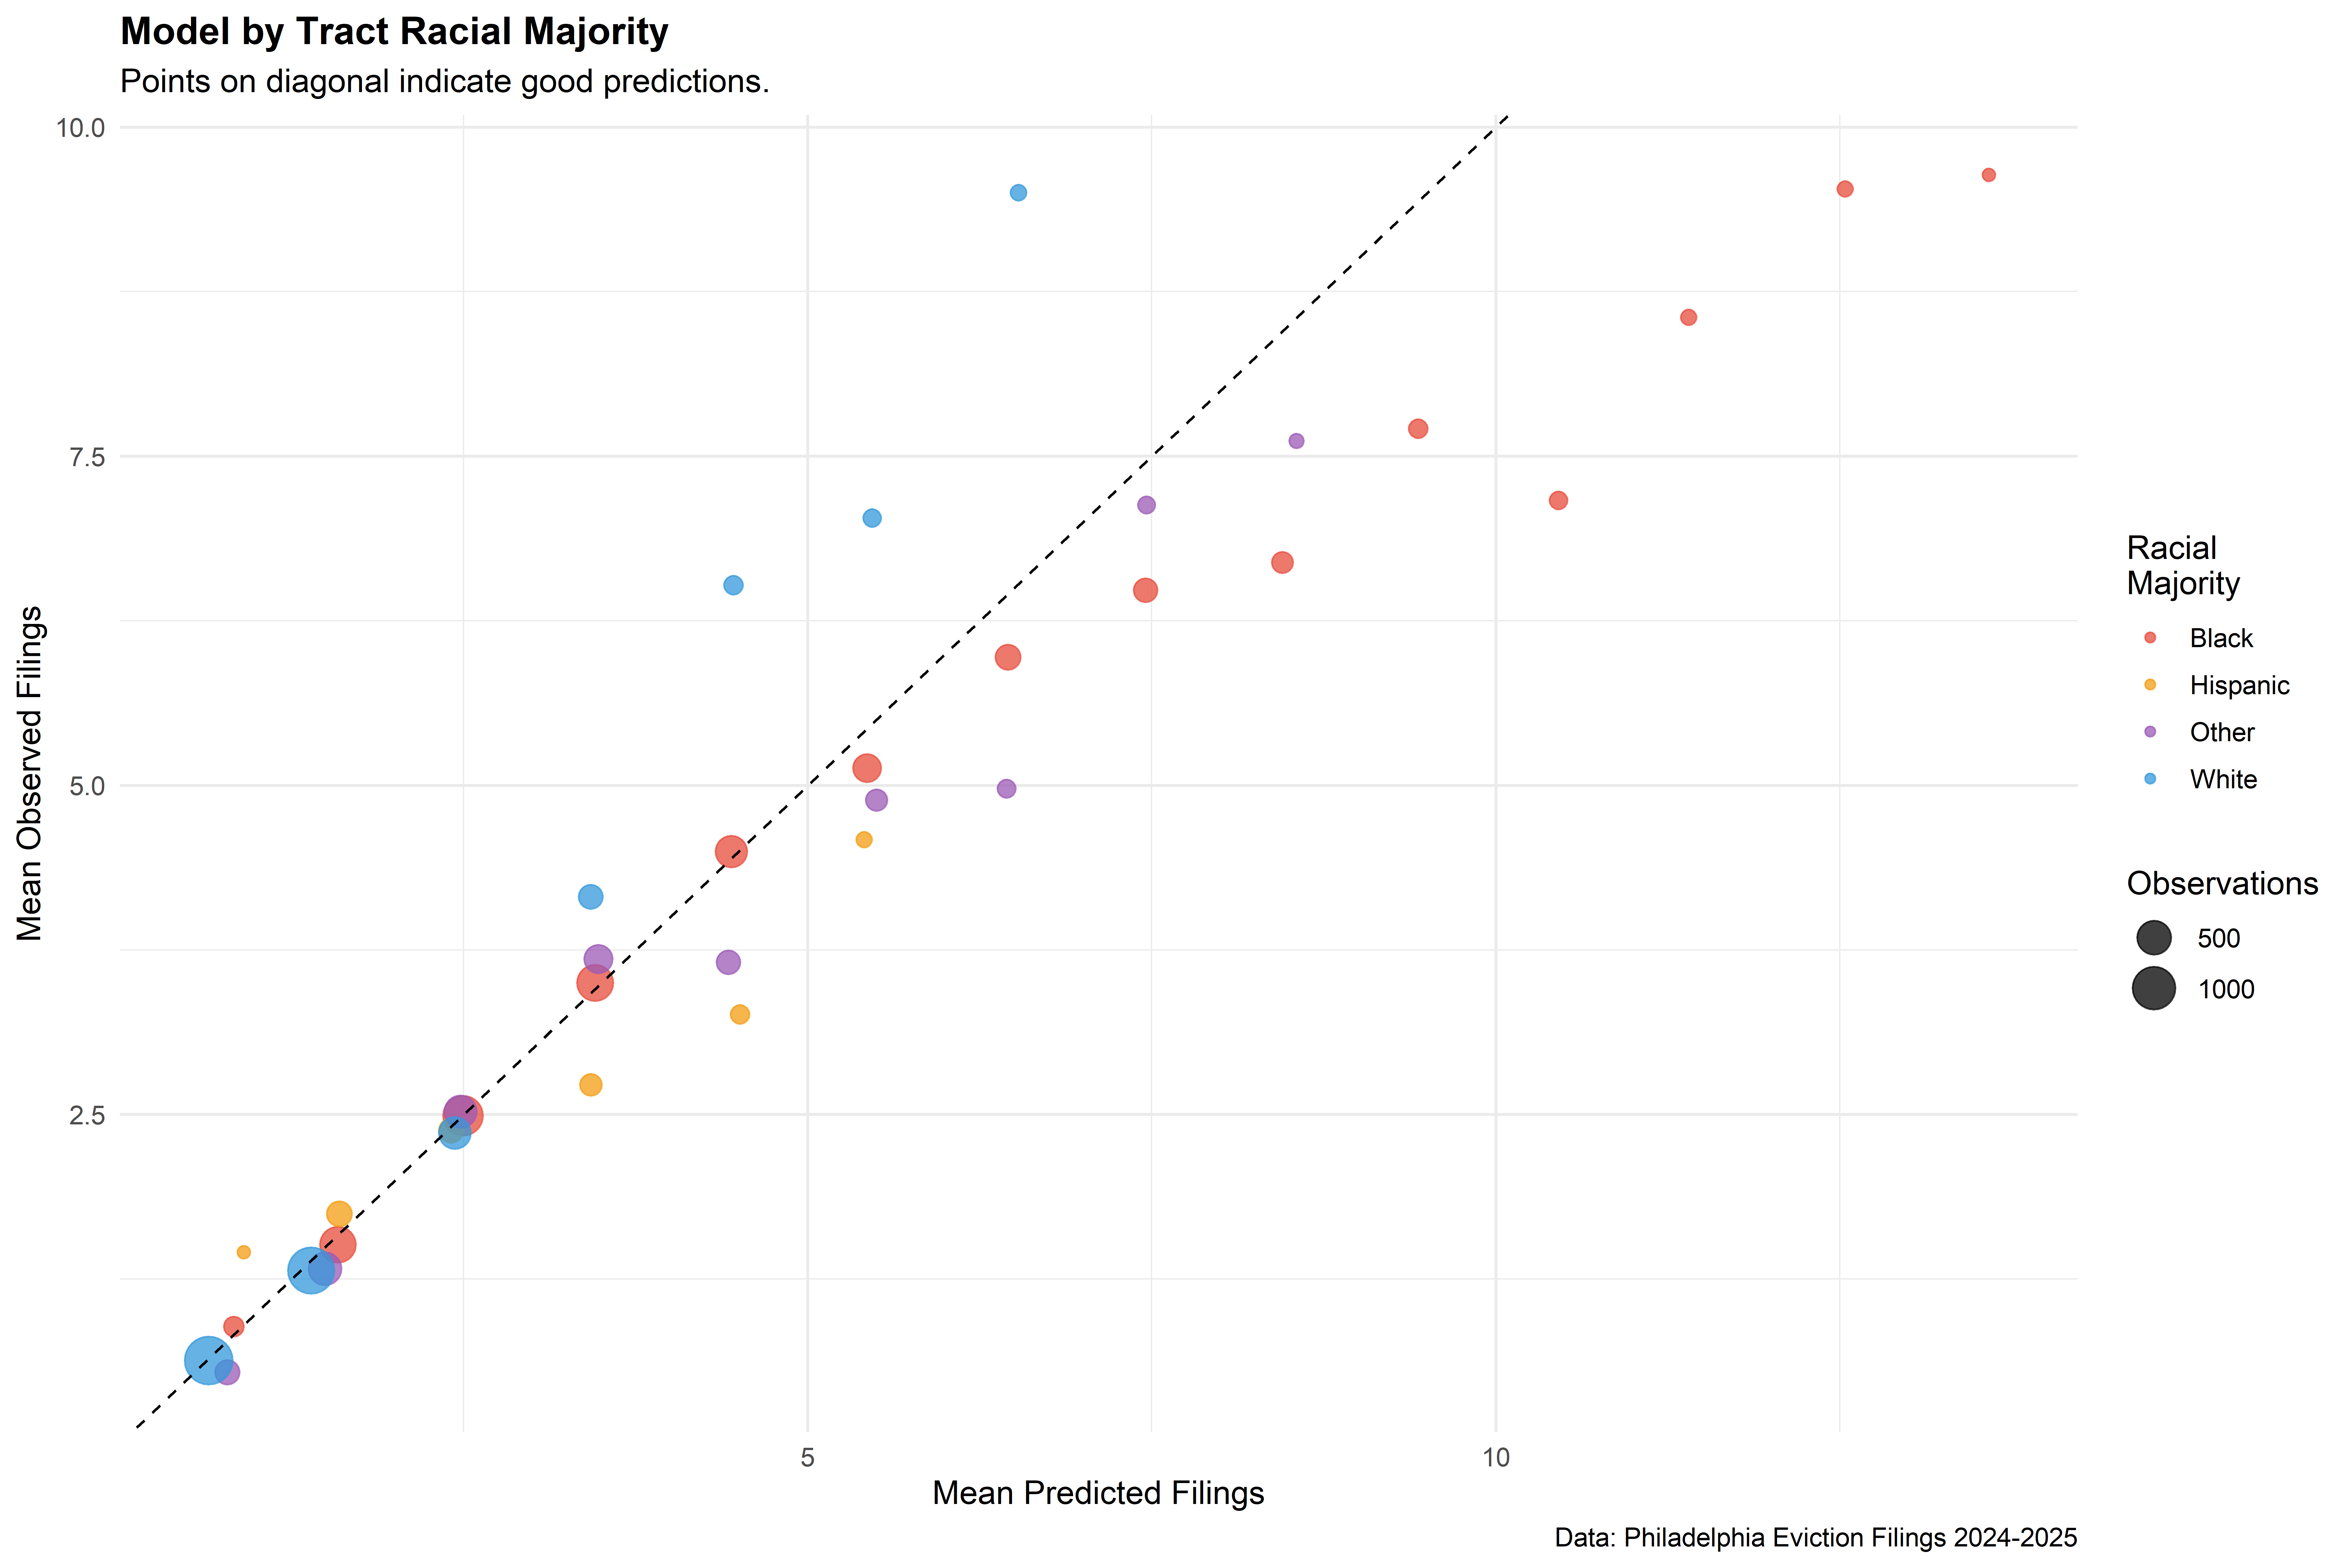
Methodology: Spatio-Temporal Modeling
Negative Binomial Model that predicts filings using:
- Momentum: Filings from month before.
- Contagion: Average filings of neighboring tracts.
- Structure: Neighborhoods, Poverty, Tax Delinquency, and Demographics.
- Policy: Moratorium active/inactive status.
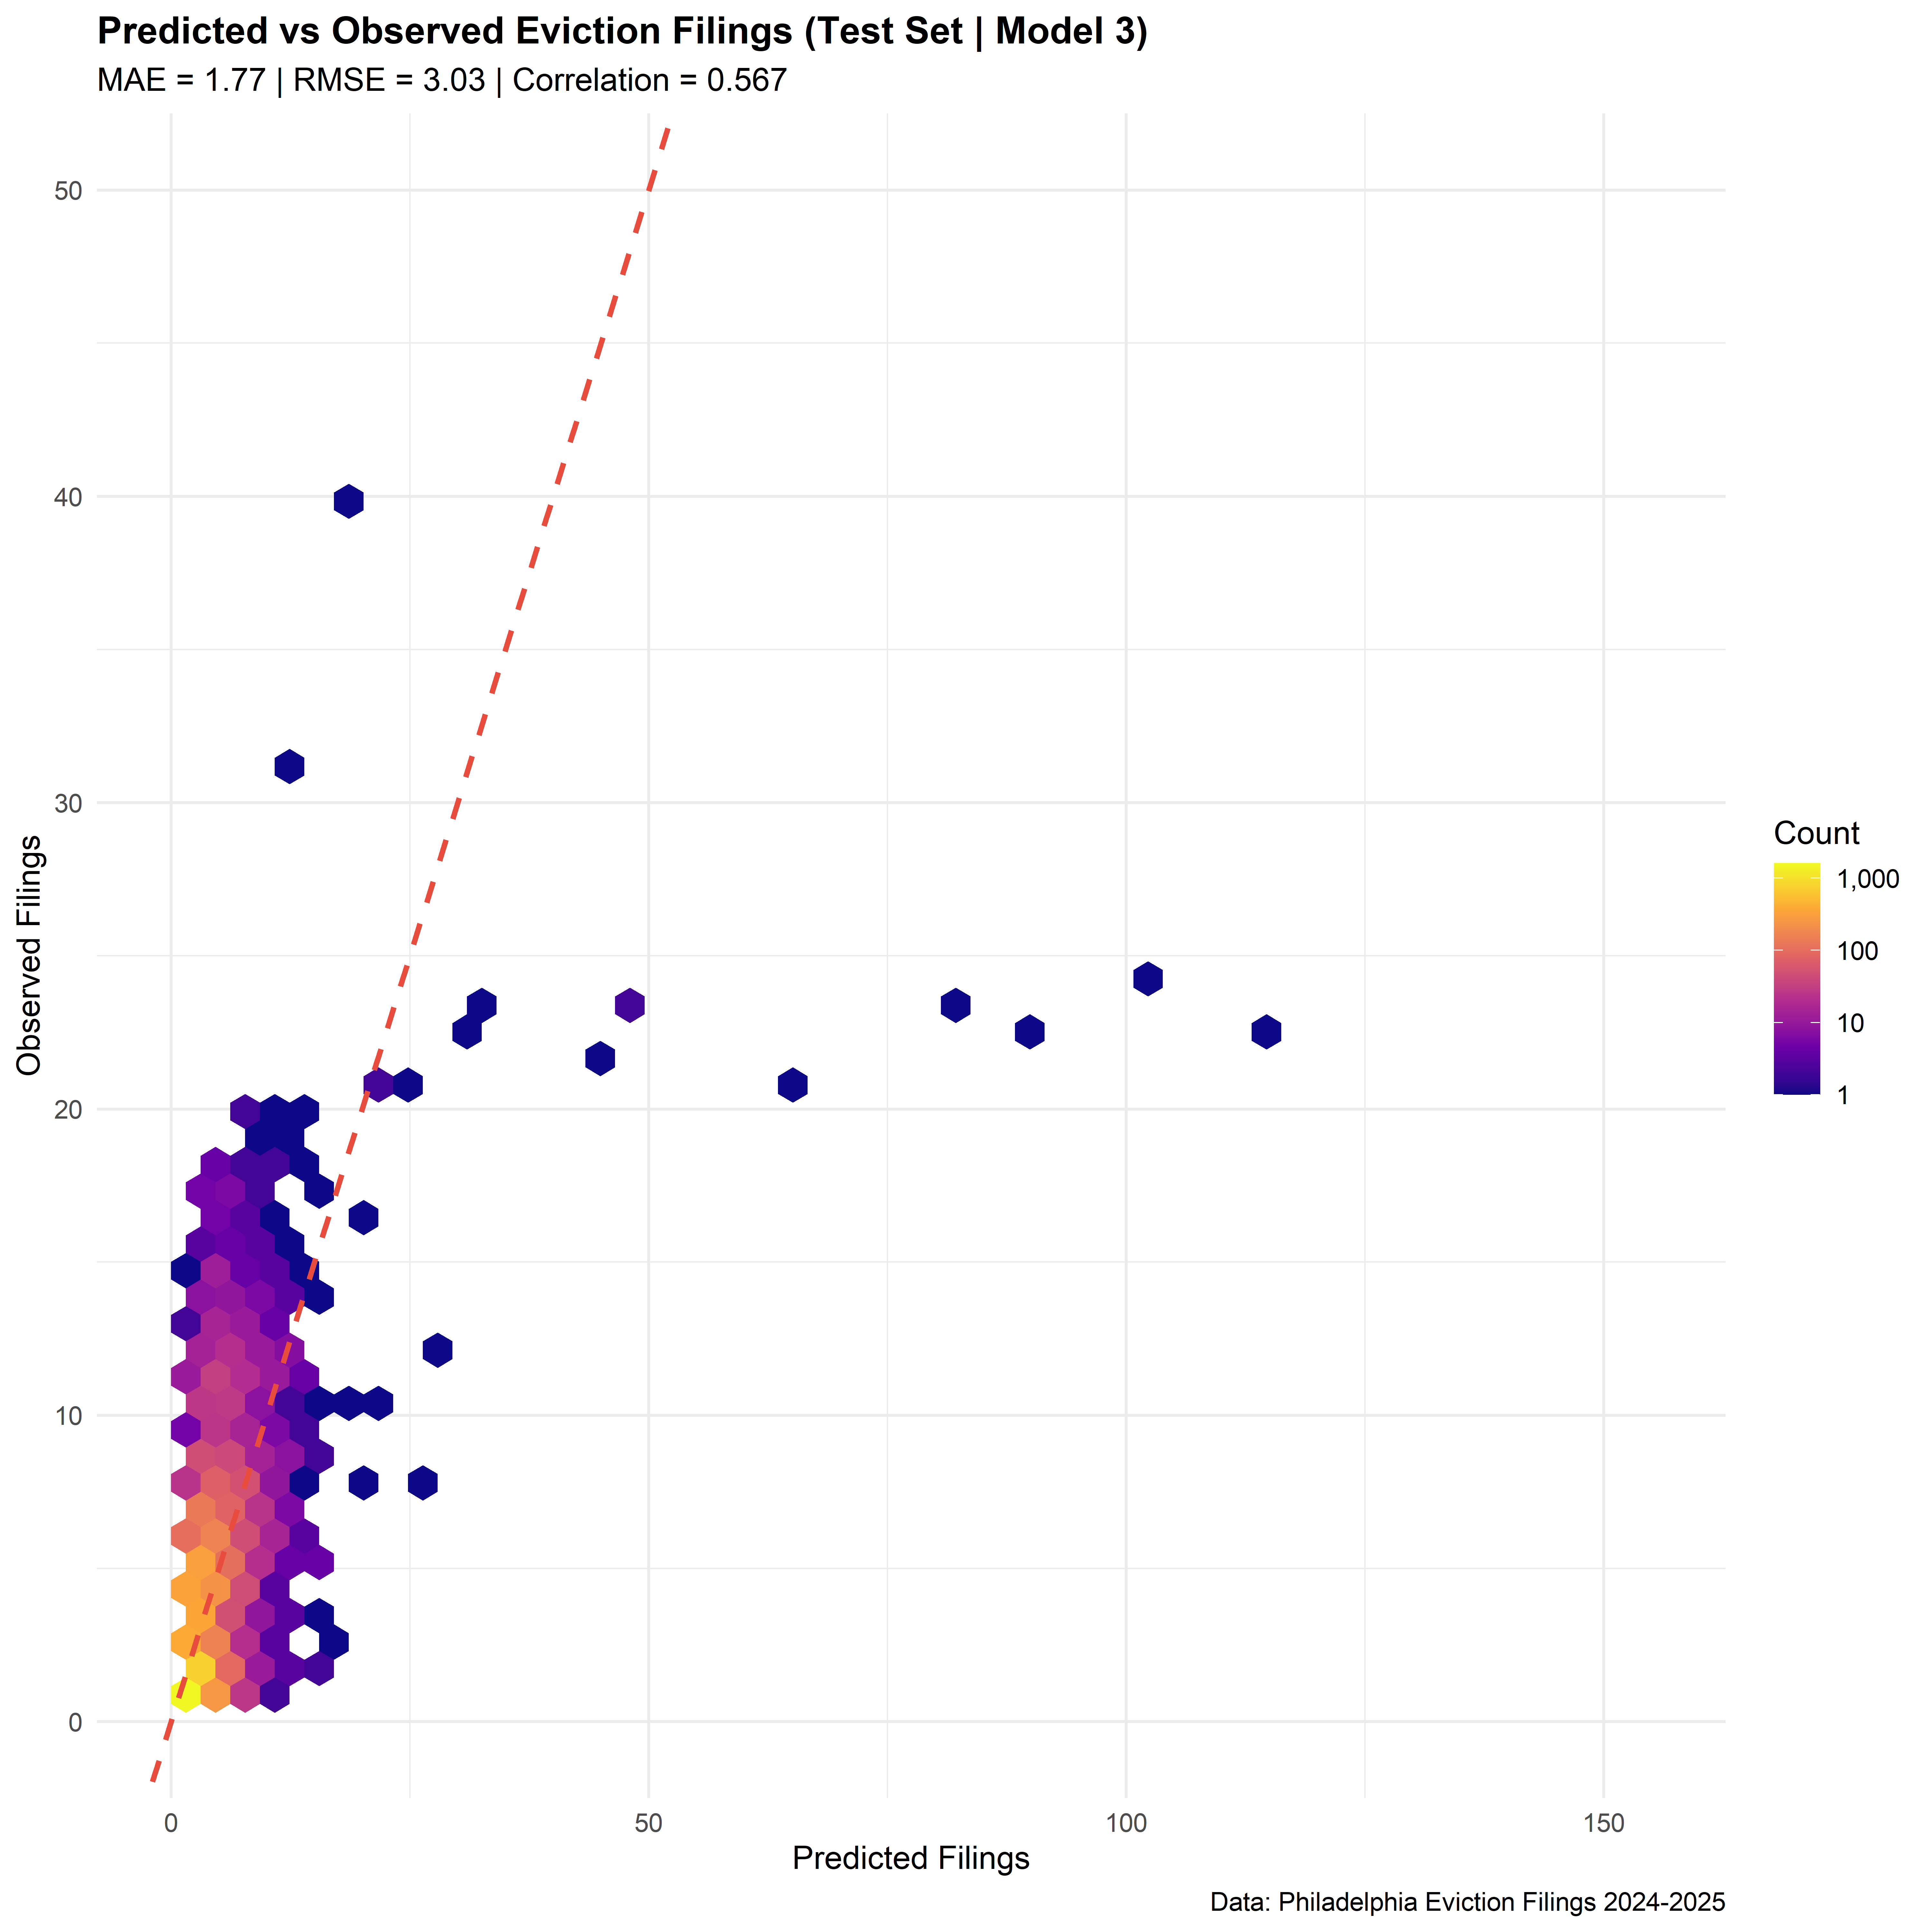
Accuracy: Within < 2 filings per tract.
Stability: RMSE change is -5, so it’s better on unseen data.
Risk Triage
![]()
- Tracts flagged as “Critical Risk” saw 5x more actual evictions than those flagged as “Low Risk.”
- Model works as a Triage Tool for resource allocation.
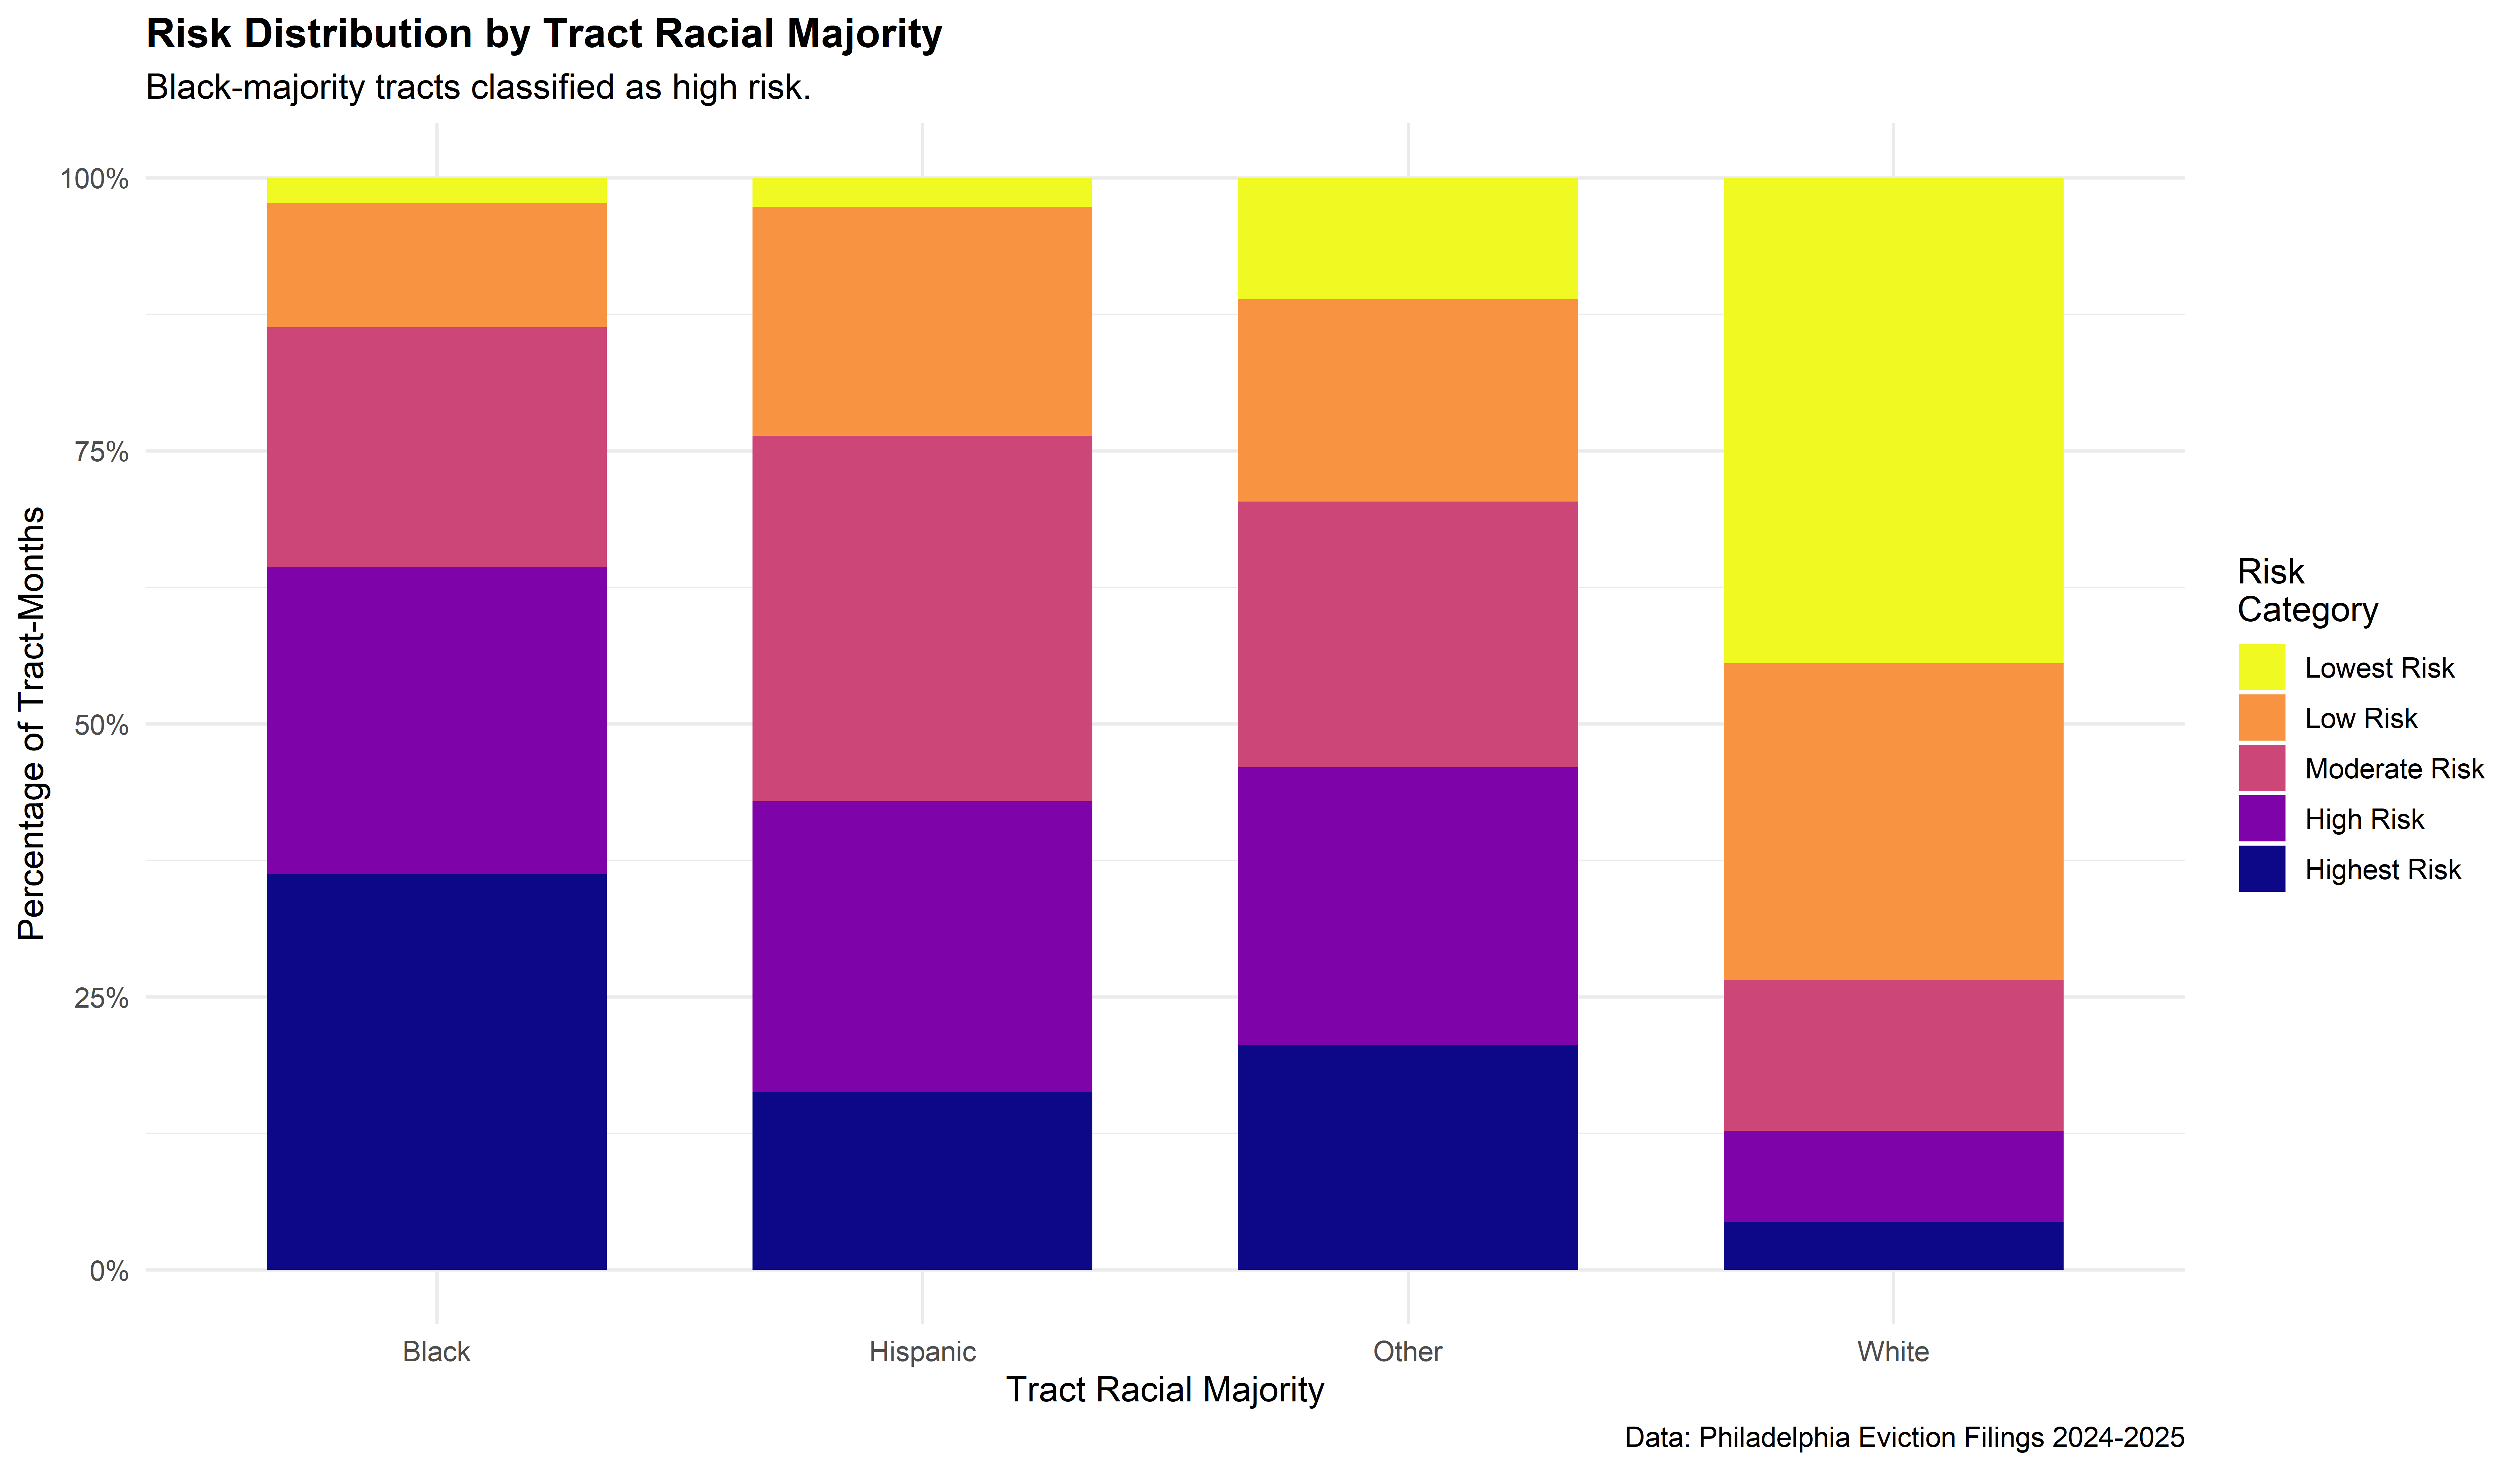
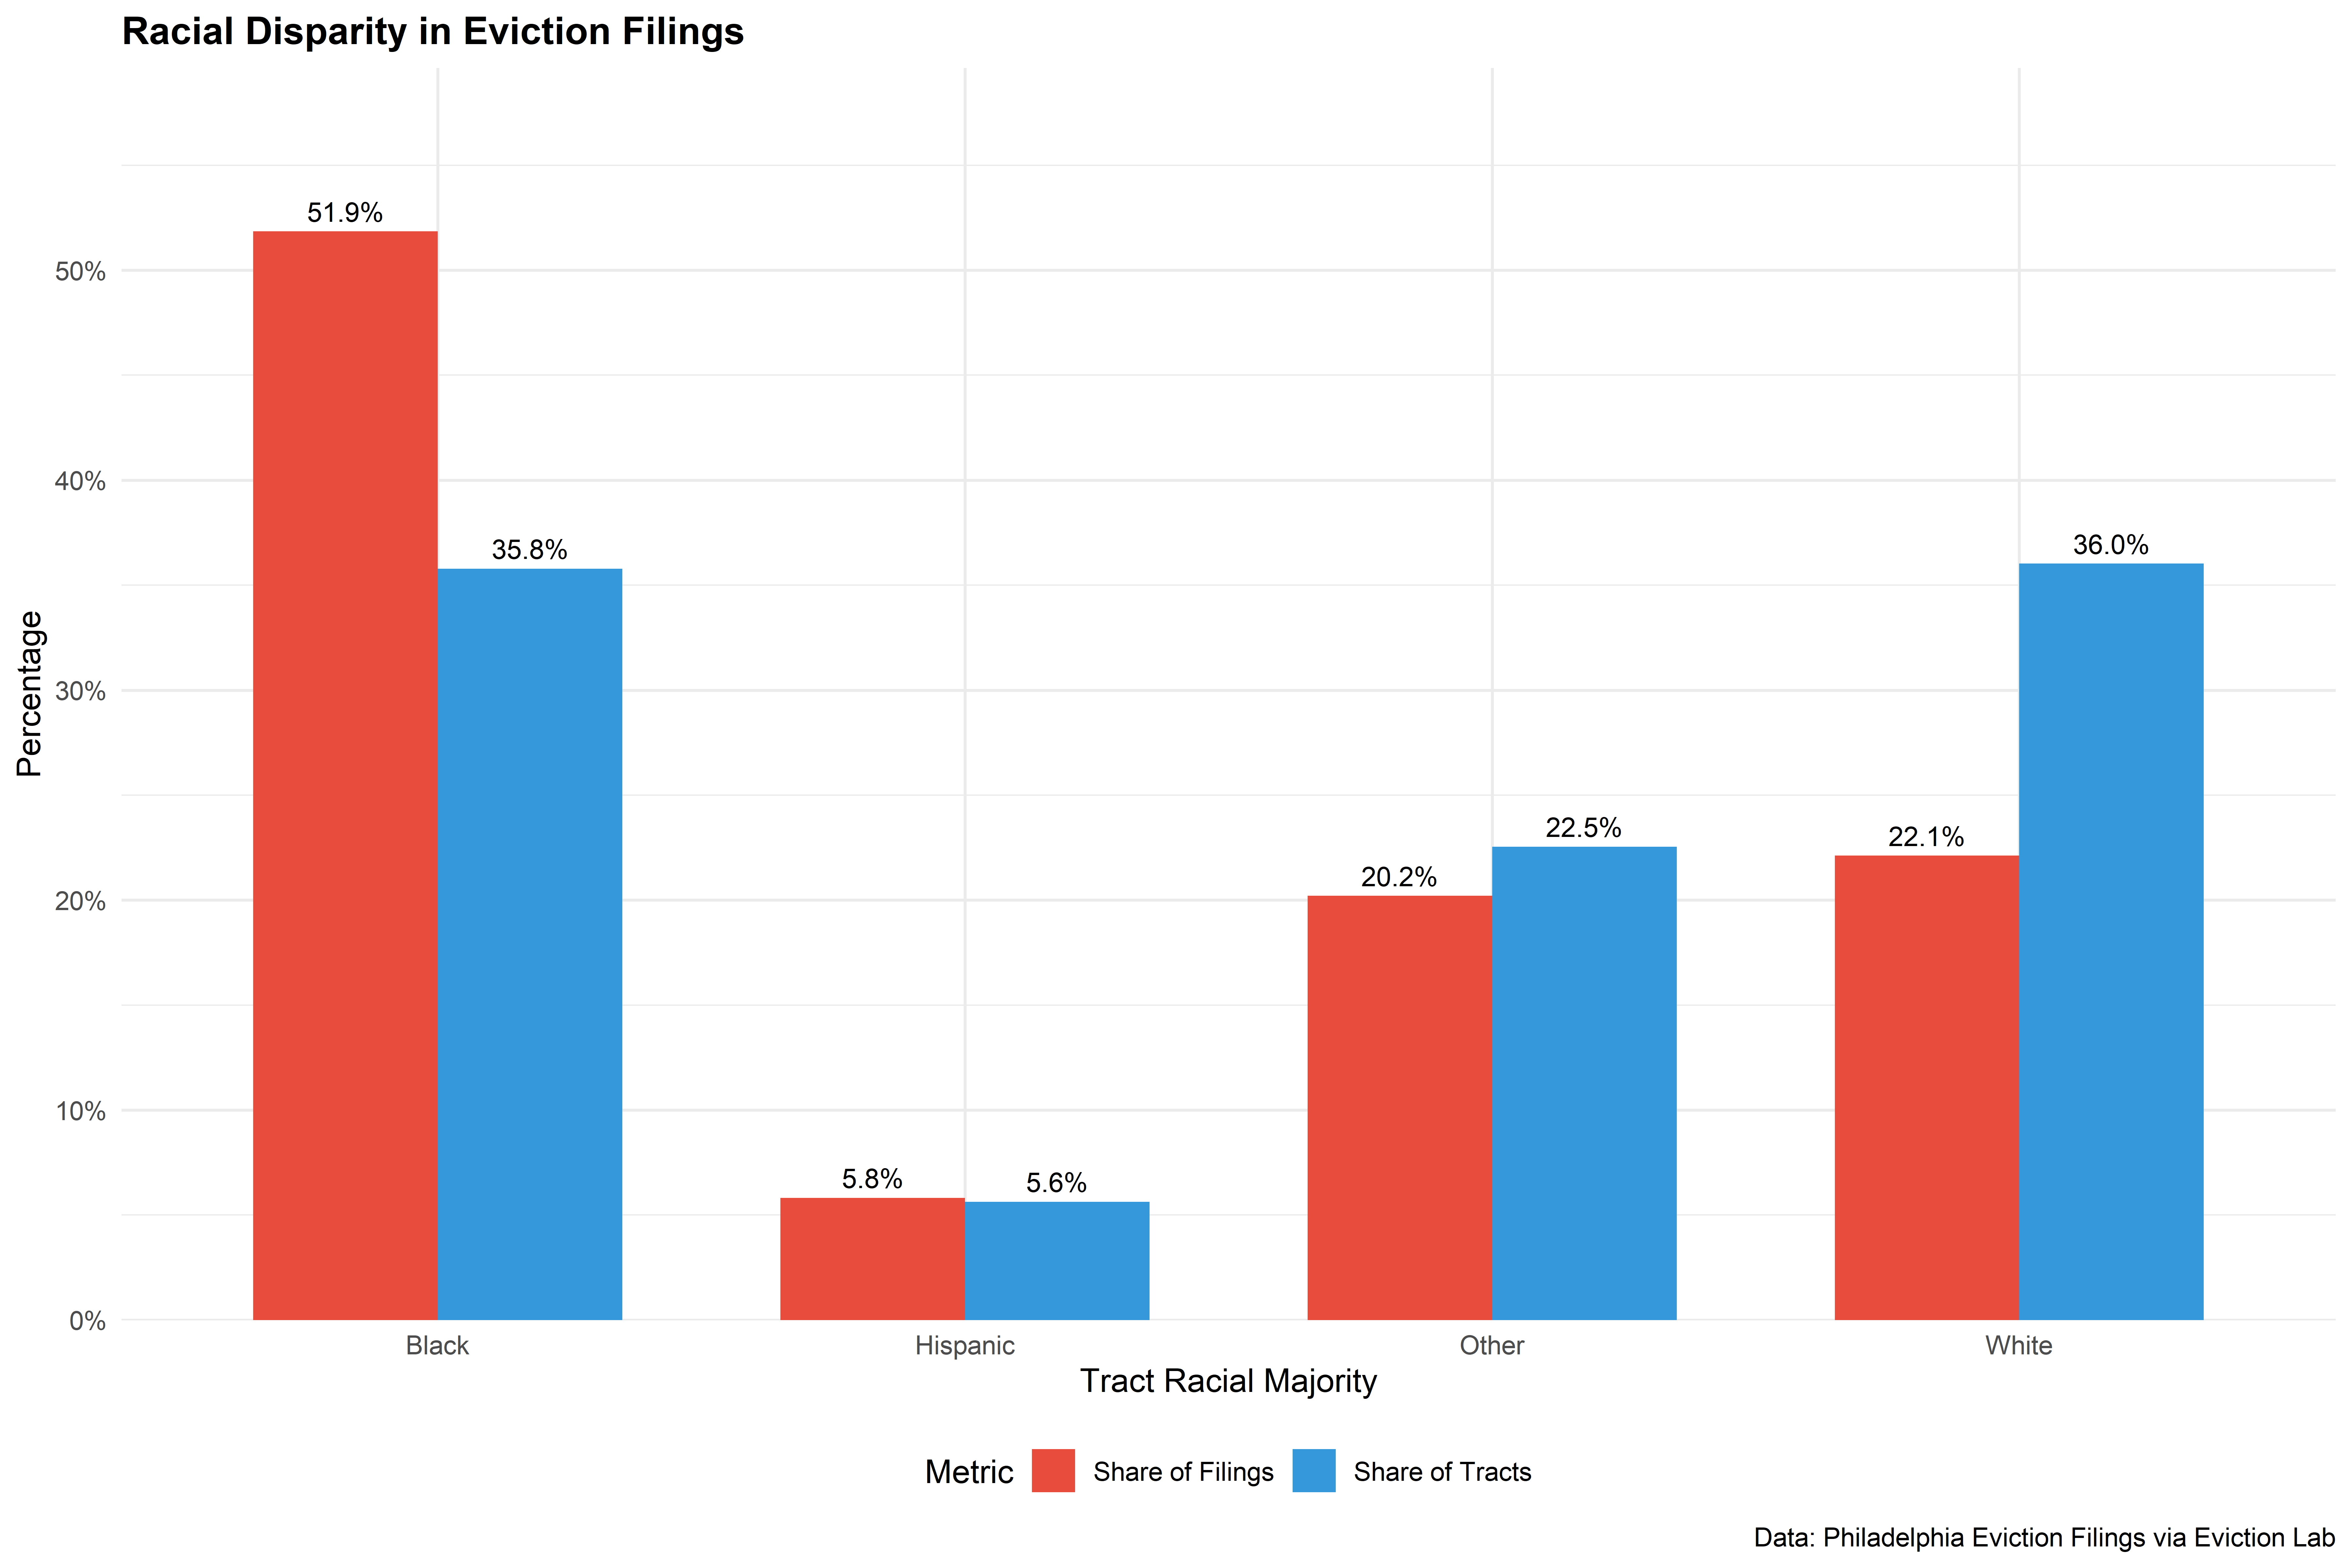
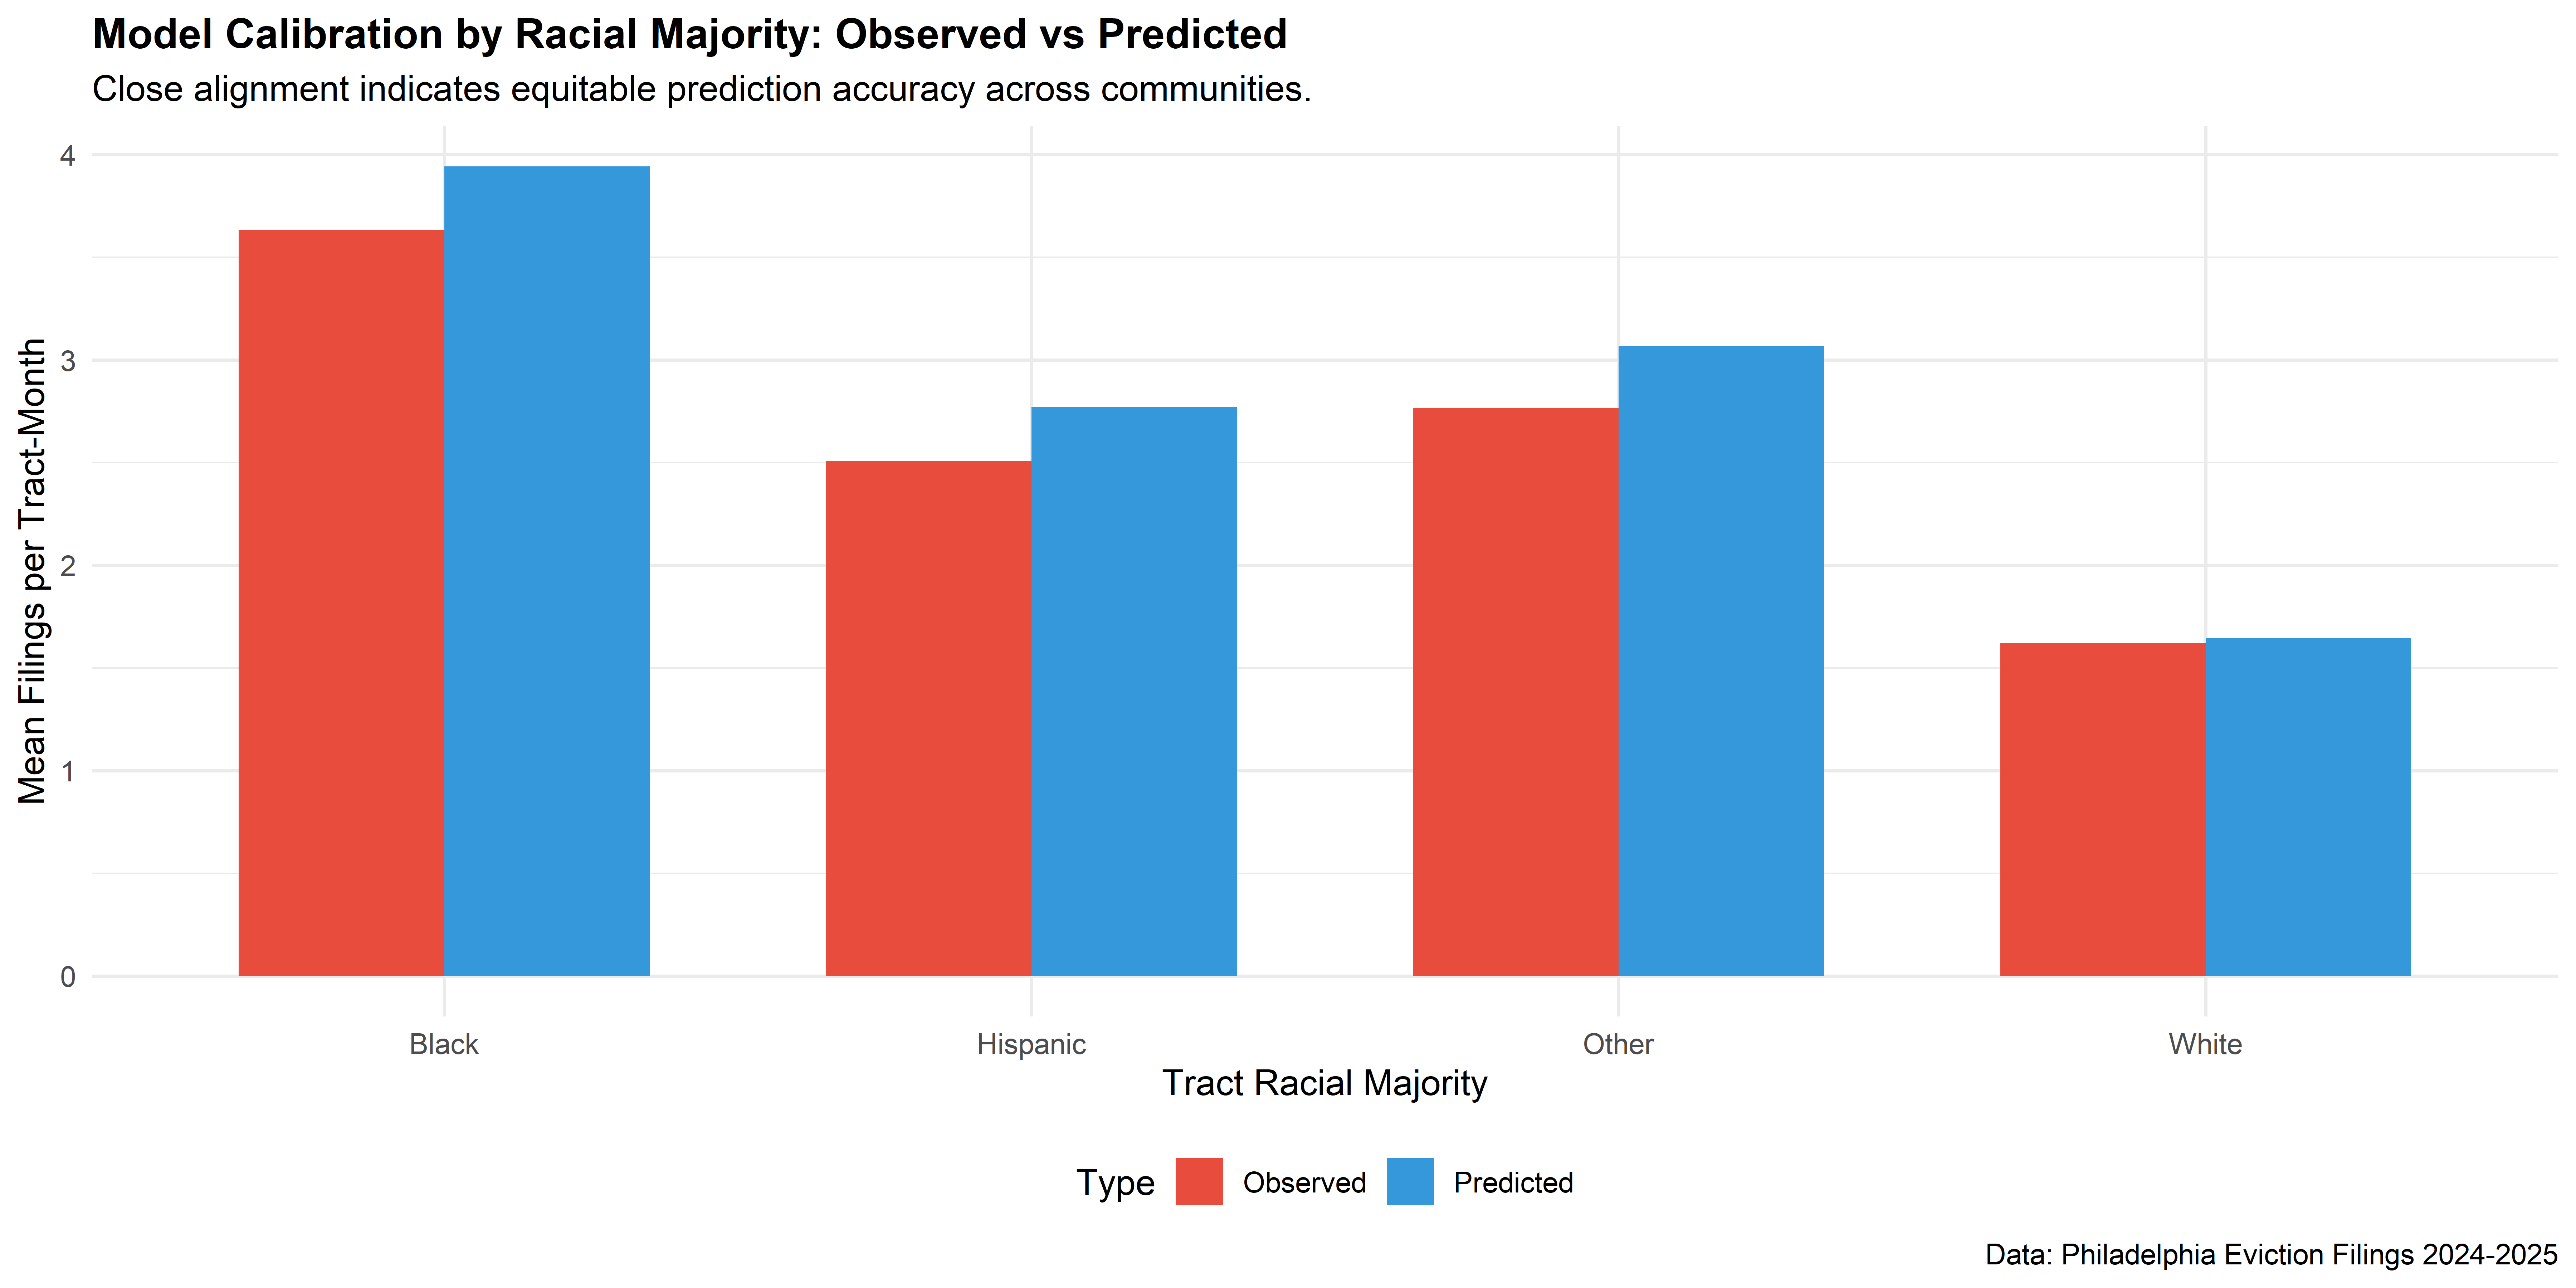
Structural Inequity
![]()
Black-majority tracts face higher risk.
Model Accurately Predicts Disparity
Model reproduces structural bias to identify communities most at risk.
![]()
Limitations
- Mass Events
- Stale Data
- Sealed Tracts
- Variability
Recommendations for Implementation
Triage Dashboard
- Run Monthly: Input new filing data on the 1st of the month.
- Generate List: Output Top 50 “Critical Risk” Tracts.
- Targeted Intervention:
- Canvassing / Legal Aid: Deploy teams, allocate resources.
- Safeguard: Tool strictly for adding resources, never for automated decision-making.